Fig. 2
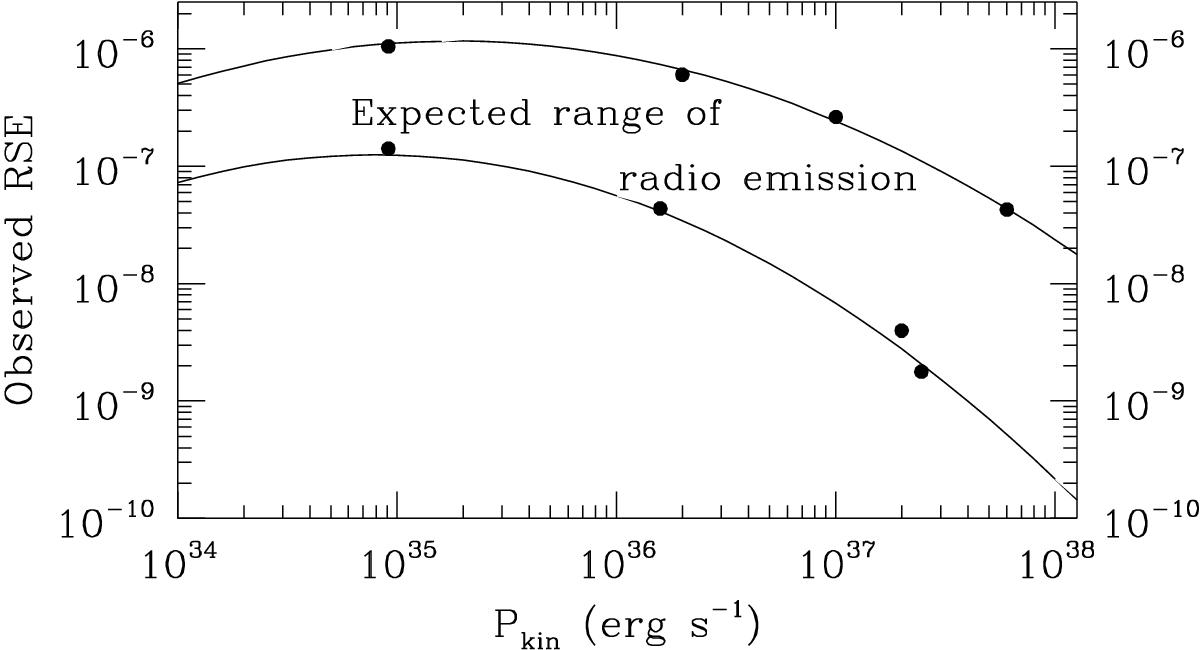
Rough estimate of the expected region of radio emission as a function of the kinetic power based on the radio synchrotron efficiency (RSE) derived for the members of the catalogue of PACWBs (truncated banana diagram). The two curves correspond to Eqs. (1) and (2). The black bullets represent the data points used for the quadratic regression.
Current usage metrics show cumulative count of Article Views (full-text article views including HTML views, PDF and ePub downloads, according to the available data) and Abstracts Views on Vision4Press platform.
Data correspond to usage on the plateform after 2015. The current usage metrics is available 48-96 hours after online publication and is updated daily on week days.
Initial download of the metrics may take a while.