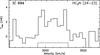
Fig. 2
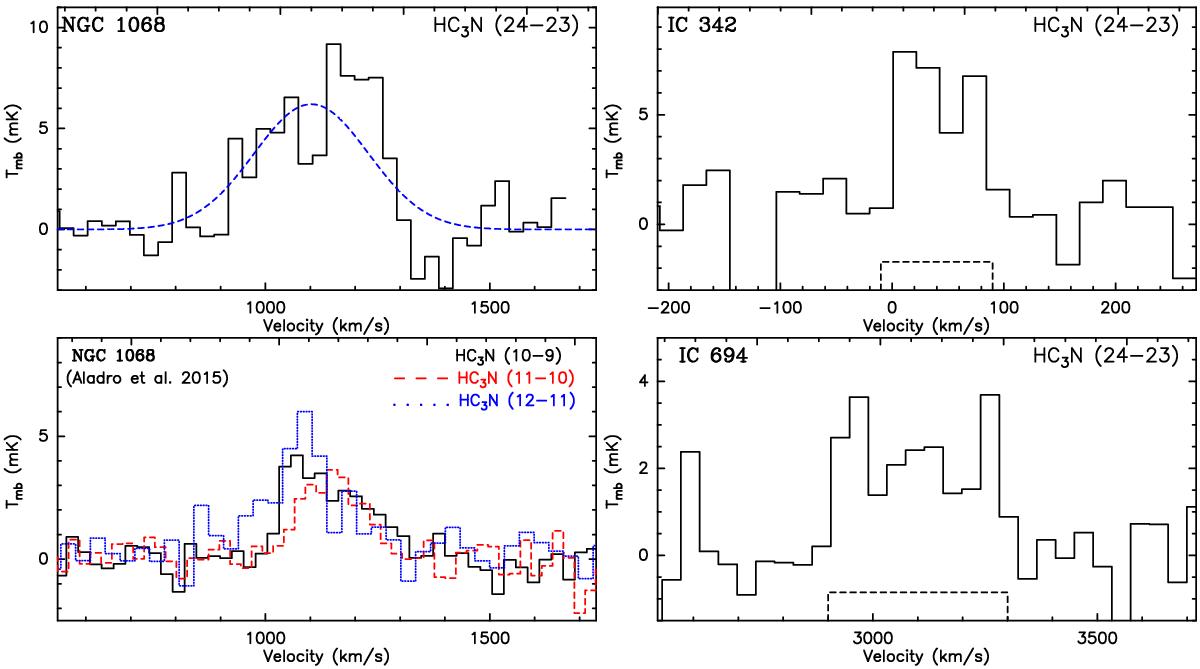
Spectra of detected HC3N(J = 24−23) in NGC 1068, IC 342 and IC 694 by the SMT. At the bottom left, the spectra of NGC 1068 from Aladro et al. (2015) are shown for comparison. Blue dashed line is the Gaussian fit. We note that, in IC 694, it is difficult to distinguish the HC3N emission from the possibly blended H2CO lines. The temperature scale is Tmb in mK.
Current usage metrics show cumulative count of Article Views (full-text article views including HTML views, PDF and ePub downloads, according to the available data) and Abstracts Views on Vision4Press platform.
Data correspond to usage on the plateform after 2015. The current usage metrics is available 48-96 hours after online publication and is updated daily on week days.
Initial download of the metrics may take a while.