Fig. 7
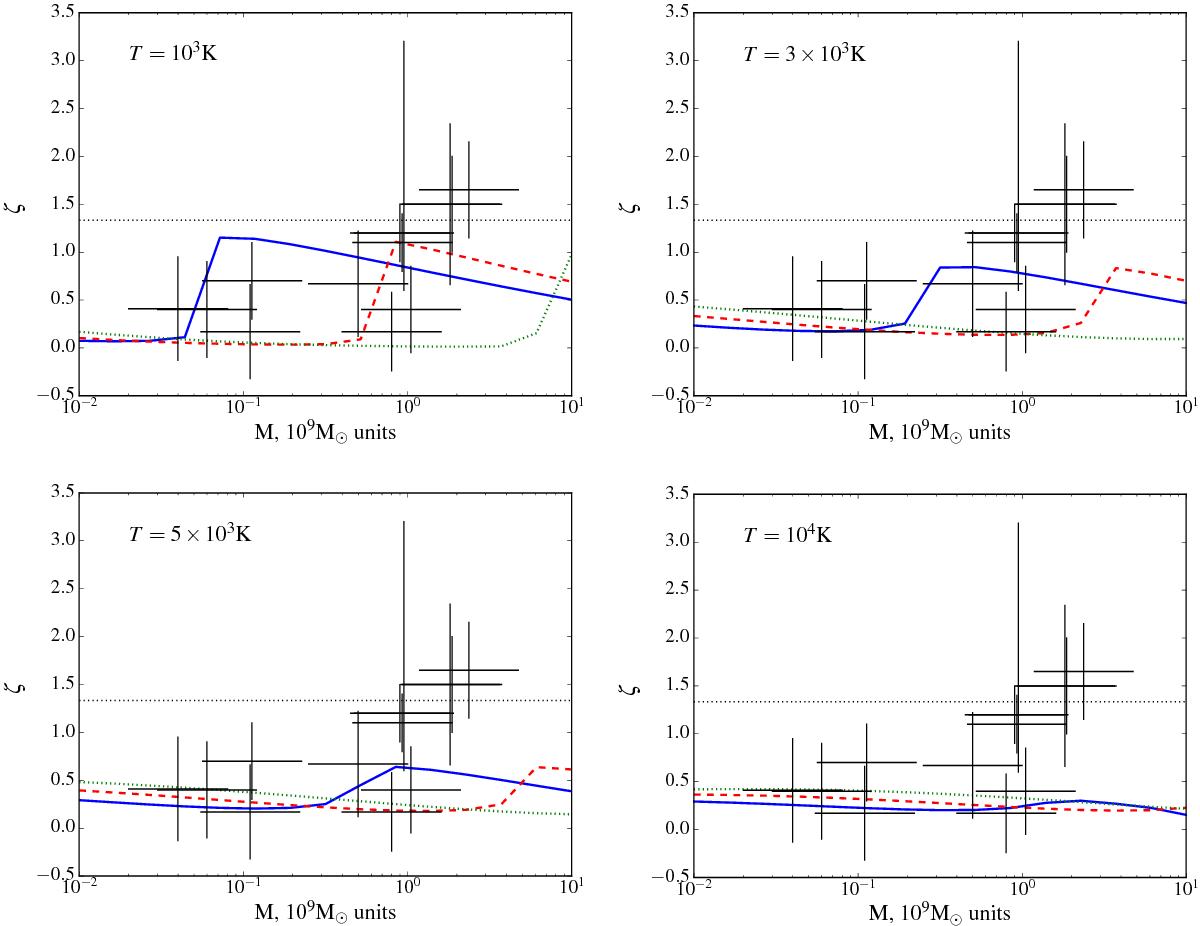
Comparison of structure parameter ζ estimated from observational data (black crosses) and calculated numerically. Virial mass is shown along the x-axes. From left to right, the outer temperature values are 103, 3 × 10³ (upper panels), 5 × 10³, and 104 K (lower panels). The three curves in every case correspond to different absolute mass accretion rates (solid blue, dashed red, and dotted green curves correspond to 1, 10, and 100 M⊙ yr-1, respectively). The horizontal dotted line corresponds to the standard disc limit ζ = 4/3. Everywhere the inflow half-opening angle is θ0 = 45°.
Current usage metrics show cumulative count of Article Views (full-text article views including HTML views, PDF and ePub downloads, according to the available data) and Abstracts Views on Vision4Press platform.
Data correspond to usage on the plateform after 2015. The current usage metrics is available 48-96 hours after online publication and is updated daily on week days.
Initial download of the metrics may take a while.