Fig. 6
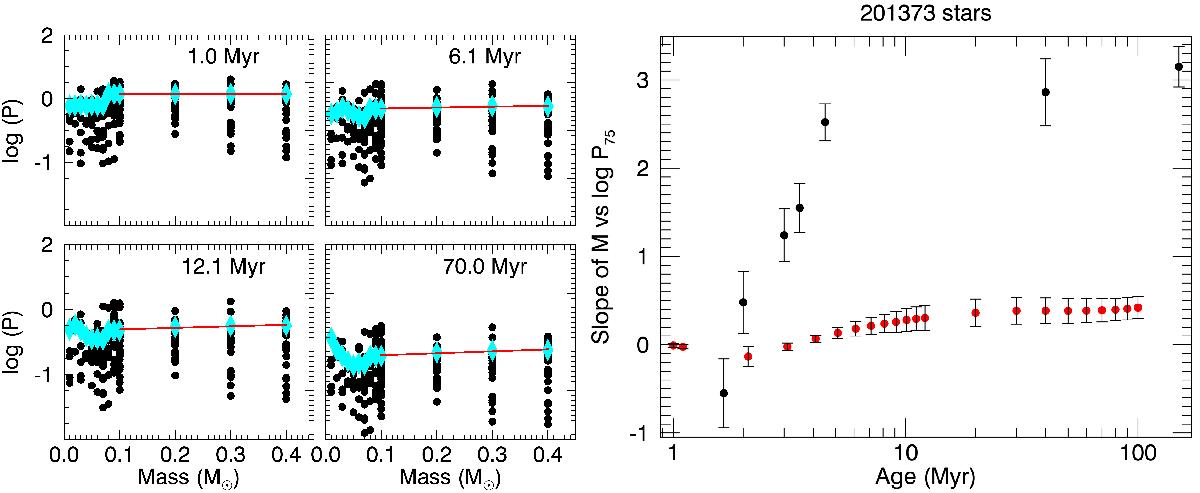
Left panels: mass versus the logarithm of the rotational period of a sample of 200 stars extracted from model M1 (black circles) at four different ages superimposed by the 75th percentiles of the log (P) (cyan diamonds). The best linear fits of the percentiles for 0.1 M⊙ ≤ M∗ ≤ 0.4 M⊙ are shown as red lines. Right panel: slope of the best linear fits plotted as a function of age (red circles) superimposed with the values obtained by Henderson & Stassun (2012) for seven clusters of different ages (black circles).
Current usage metrics show cumulative count of Article Views (full-text article views including HTML views, PDF and ePub downloads, according to the available data) and Abstracts Views on Vision4Press platform.
Data correspond to usage on the plateform after 2015. The current usage metrics is available 48-96 hours after online publication and is updated daily on week days.
Initial download of the metrics may take a while.