Fig. 10
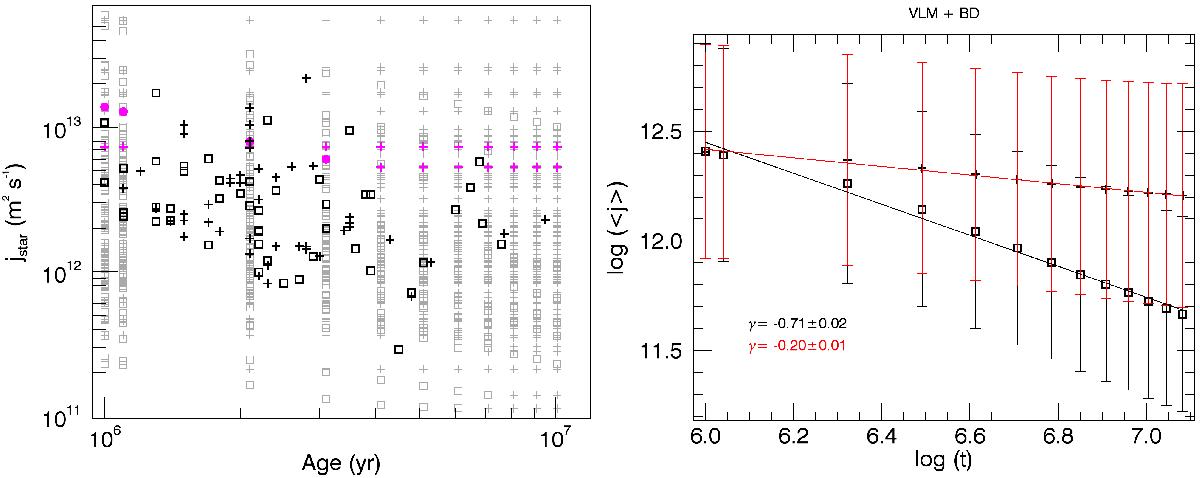
Left: specific angular momentum evolution for 100 objects randomly chosen from model M1. Simulated data are shown as light grey symbols, squares for disk objects and crosses for diskless ones. Two stars are highlighted as magenta filled circles (when in the disk phase) or crosses (when in the diskless phase) to illustrate the evolution of a single star. The black symbols are for the D14 ONC sample of stars of spectral type later than M2 whose j values were recalculated using gyration and stellar radii from the stellar evolutionary models of Baraffe et al. (1998). Squares represent Class II stars, crosses Class III stars. Right: logarithm of age versus the logarithm of median j for disk objects (black squares) and diskless objects (black crosses). Error bars (black for disk objects, red for diskless ones) show the rms of log ⟨ j ⟩ values around the median. The γ values express the time dependency ⟨ j ⟩ ∝ tγ.
Current usage metrics show cumulative count of Article Views (full-text article views including HTML views, PDF and ePub downloads, according to the available data) and Abstracts Views on Vision4Press platform.
Data correspond to usage on the plateform after 2015. The current usage metrics is available 48-96 hours after online publication and is updated daily on week days.
Initial download of the metrics may take a while.