Fig. 3
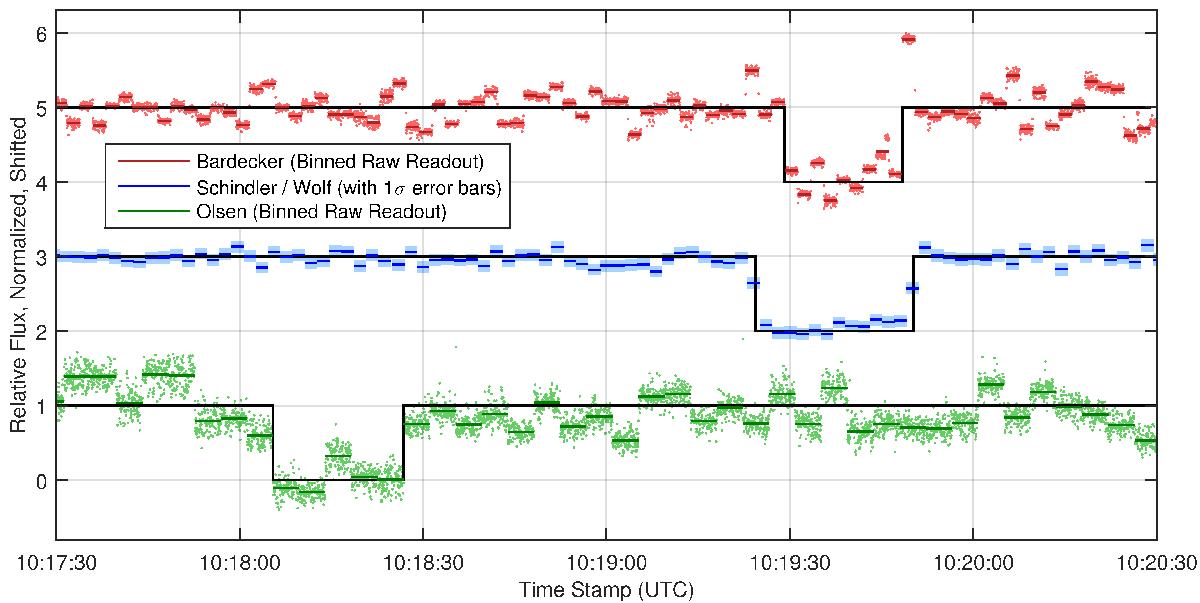
Obtained light curves for the occultation on 15 November 2014. The occultation was recorded at different times due to different longitudes and latitudes of the observatories; the shadow was moving from east to west (cf. Fig. 5). Light curves were normalized based on the combined relative flux of the star UCAC4 448-006503 and TNO 2007 UK126, averaged over all available images before and after the event. The occulted star’s apparent V-band magnitude is mV = 15.8 mag, which was four magnitudes brighter than 2007 UK126 (mV ≈ 19.8 mag). Raw data from Bardecker and Olsen is plotted in light red and light green; their video cameras were running at a fixed frame rate, accumulating n frames internally and returning the result n times at the analog video output (see Sect. 3.1 for details). Consequently, the relative flux was averaged over each bin of 64 (Bardecker, dark red) and 128 samples (Olsen, dark green; see discussion in text). Data points by Schindler & Wolf (blue) were derived from single images, with relative flux errors (1σ) plotted in light blue. The black lines represent square-well fits that were used to derive the disappearance and reappearance times for each chord (see text for details).
Current usage metrics show cumulative count of Article Views (full-text article views including HTML views, PDF and ePub downloads, according to the available data) and Abstracts Views on Vision4Press platform.
Data correspond to usage on the plateform after 2015. The current usage metrics is available 48-96 hours after online publication and is updated daily on week days.
Initial download of the metrics may take a while.