Fig. 1
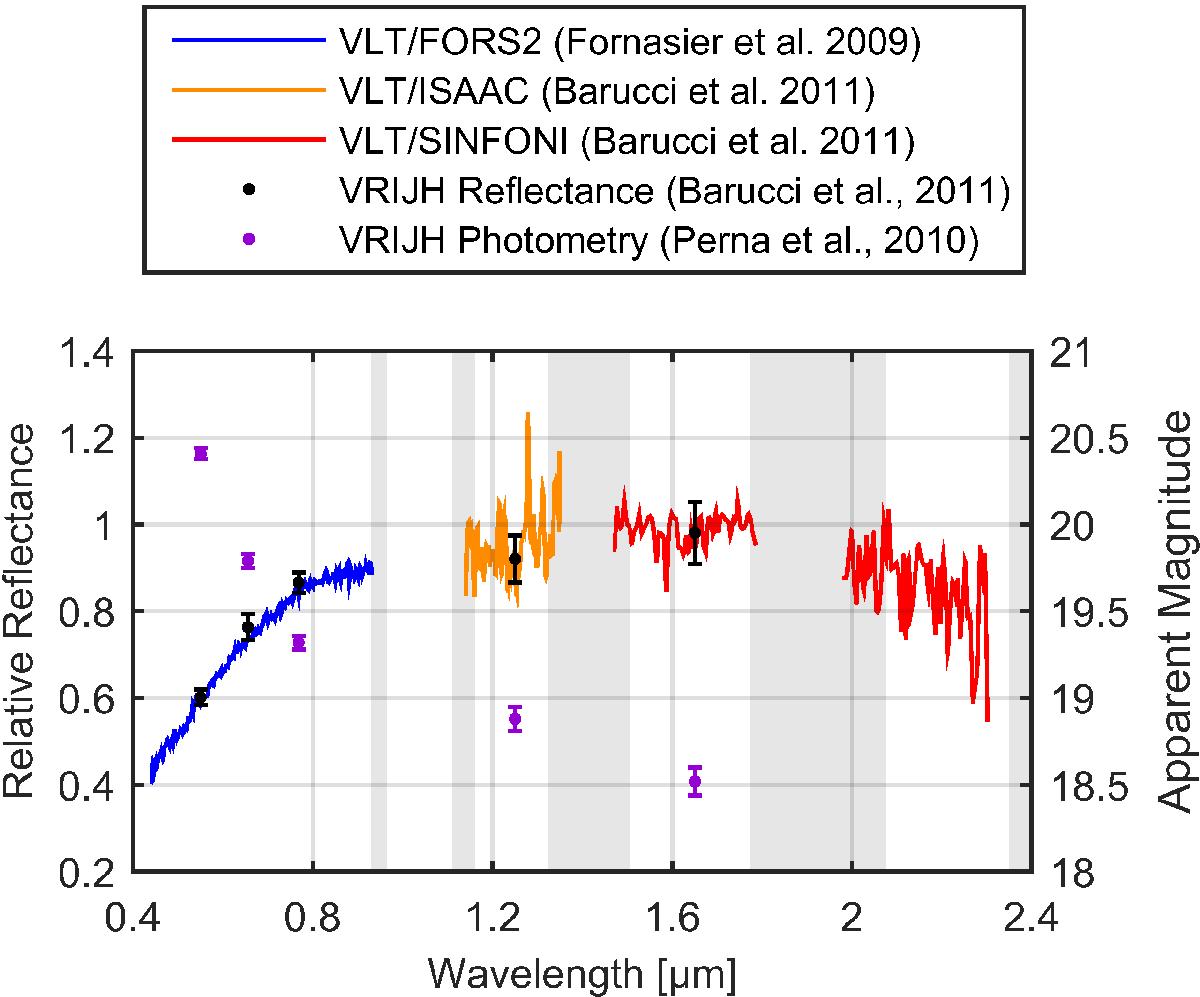
Visible and near-infrared reflectance spectra and photometry, obtained using multiple instruments at ESO’s VLT on 21 and 22 September 2008. To concatenate spectral data from different instruments, photometry (purple) was converted to relative reflectance (black) and used as an indicator for alignment (see discussion in Barucci et al. 2011). Zones marked in gray denote telluric bands of the Earth’s atmosphere. See text for details.
Current usage metrics show cumulative count of Article Views (full-text article views including HTML views, PDF and ePub downloads, according to the available data) and Abstracts Views on Vision4Press platform.
Data correspond to usage on the plateform after 2015. The current usage metrics is available 48-96 hours after online publication and is updated daily on week days.
Initial download of the metrics may take a while.