Fig. 6
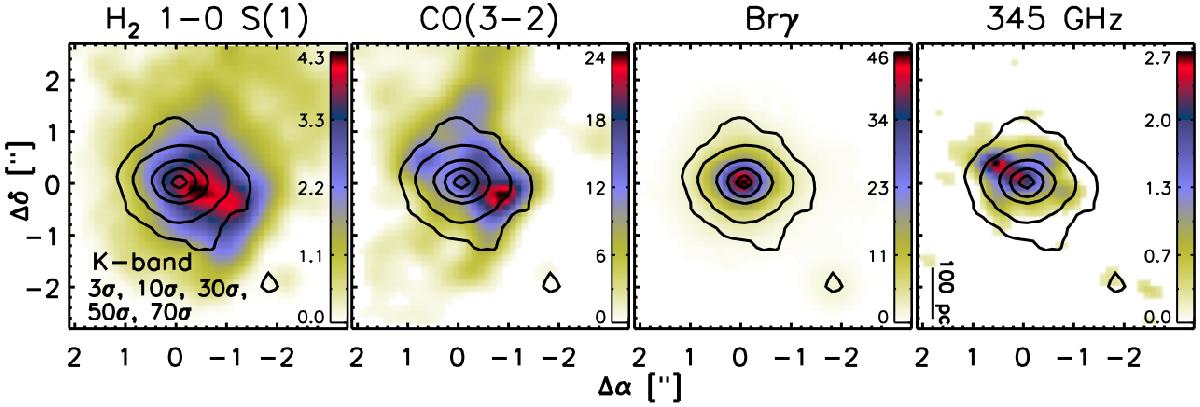
Intensity maps for SGMC 4/5. From left to right, K-band continuum emission contours overlaid on the H2 1−0 S(1) emission, CO(3−2) emission, Brγ emission, and continuum emission at 345 GHz. Flux units of the color bars are × 10-17 erg s-1 cm-2 for H2 and Brγ, Jy beam-1 for CO(3−2), and mJy beam-1 for the continuum emission. The 1σ emission level of the K-band continuum emission is 2.05 × 10⁻²⁰ erg s-1 cm-2. The peak emission of the K-band contours marks the position of the SSC B1, which corresponds to the offset position (0, 0). Offset positions are as in Fig. 4.
Current usage metrics show cumulative count of Article Views (full-text article views including HTML views, PDF and ePub downloads, according to the available data) and Abstracts Views on Vision4Press platform.
Data correspond to usage on the plateform after 2015. The current usage metrics is available 48-96 hours after online publication and is updated daily on week days.
Initial download of the metrics may take a while.