Fig. 5
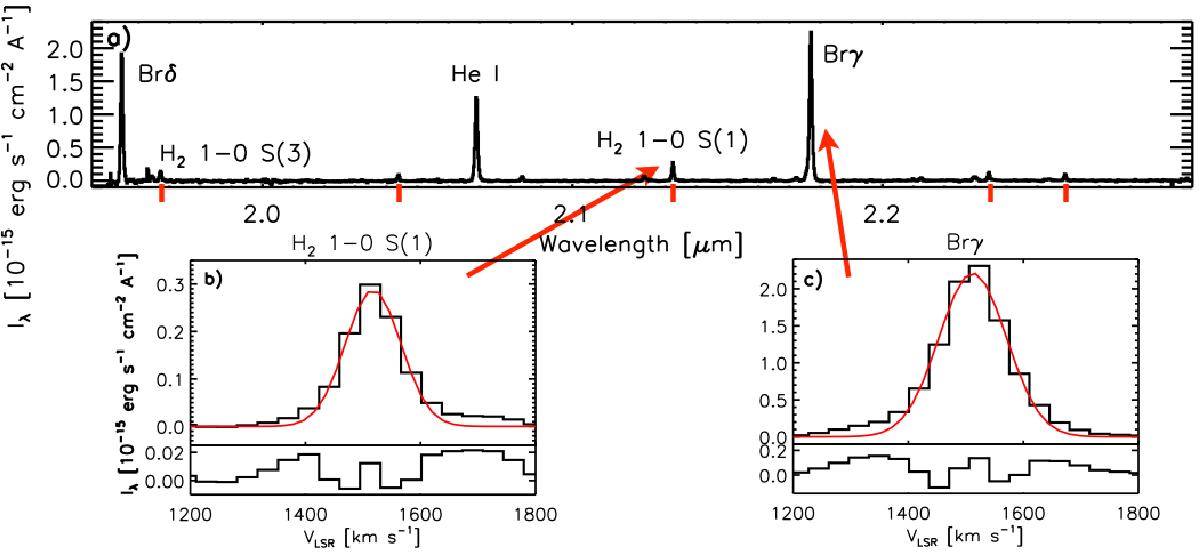
Upper panel: K-band spectrum of SSC B1, obtained from aperture photometry based on the Brγ line. Ionized gas lines are the brightest lines across the spectrum. We mark the position of the H2 rovibrational lines with short red lines. Lower panels: zoom in the H2 1−0 S(1) and Brγ lines. Red lines represent the fitted Gaussian curves to each line, and residuals are plotted in the bottom part. Table 3 lists the parameters of the Gaussian fits.
Current usage metrics show cumulative count of Article Views (full-text article views including HTML views, PDF and ePub downloads, according to the available data) and Abstracts Views on Vision4Press platform.
Data correspond to usage on the plateform after 2015. The current usage metrics is available 48-96 hours after online publication and is updated daily on week days.
Initial download of the metrics may take a while.