Fig. 4
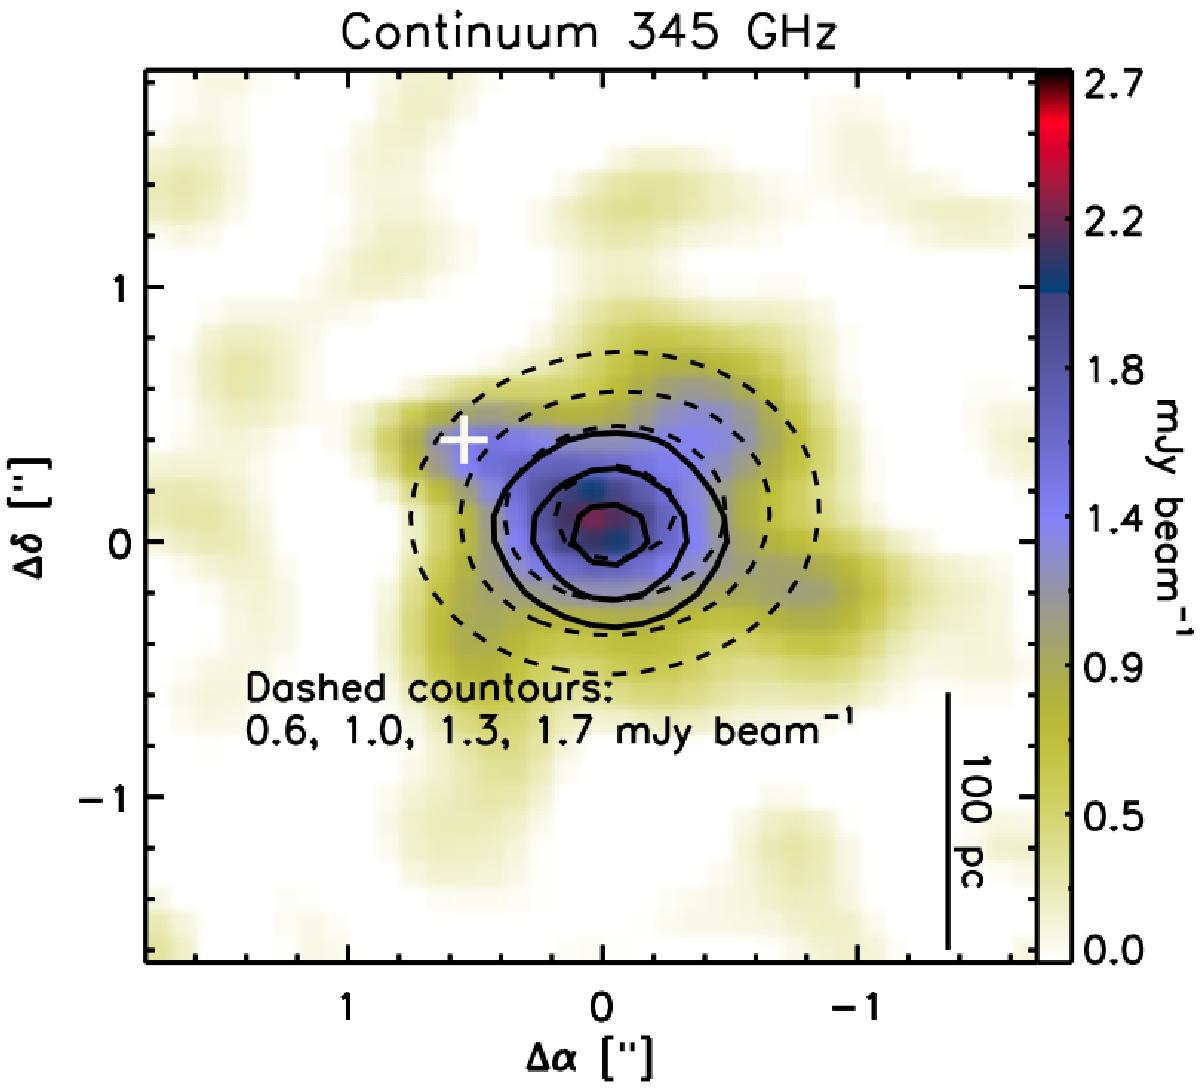
Continuum emission at 345 GHz. Emission from H2O maser was subtracted. The white cross marks the position of the H2O maser. Solid black lines are the 50%, 70%, and 90% of the peak of the Brγ line emission (see Fig. 6). Dashed black contours correspond to the 2D Gaussian fit to the continuum emission. Offset positions are relative to α: 12h01m54![]() 95, δ: –18°53′05.̋6 J2000.0. The offset position (0, 0) corresponds to the position of the SSC B1, which coincides with the continuum peak emission.
95, δ: –18°53′05.̋6 J2000.0. The offset position (0, 0) corresponds to the position of the SSC B1, which coincides with the continuum peak emission.
Current usage metrics show cumulative count of Article Views (full-text article views including HTML views, PDF and ePub downloads, according to the available data) and Abstracts Views on Vision4Press platform.
Data correspond to usage on the plateform after 2015. The current usage metrics is available 48-96 hours after online publication and is updated daily on week days.
Initial download of the metrics may take a while.