Fig. 12
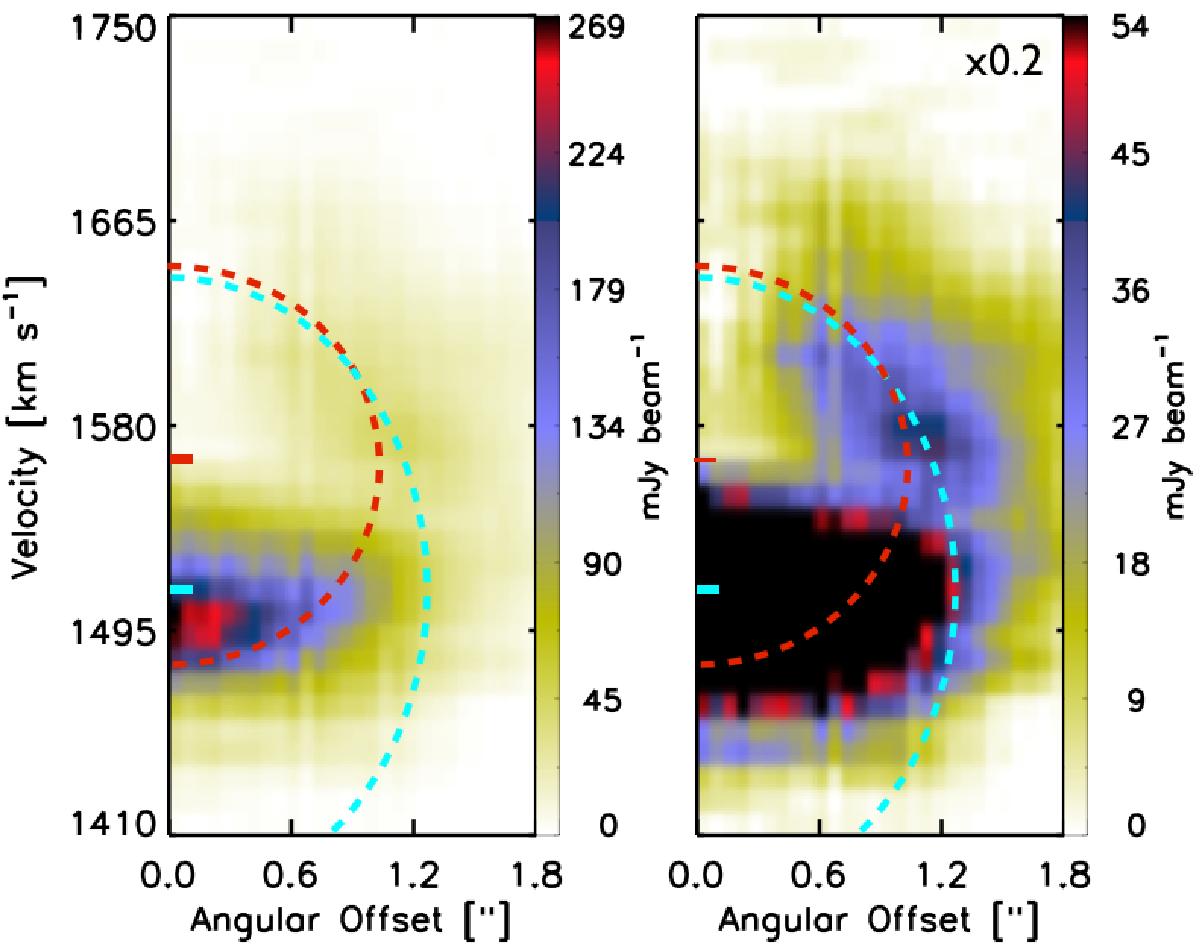
Azimuthally averaged CO(3−2) emission, around the position of SSC B1 up to a maximum radius of 1.̋8. The left panel shows the total emission and the right panel shows the emission clipped up to a maximum value of 20% of the peak emission. The semi-ellipse in dashed-red line highlights the expanding shell assuming a central velocity of ~1565 km s-1 marked with a red tick on the velocity axis, while for the dashed-cyan line, the central velocity is equal to that of the Brγ emission.
Current usage metrics show cumulative count of Article Views (full-text article views including HTML views, PDF and ePub downloads, according to the available data) and Abstracts Views on Vision4Press platform.
Data correspond to usage on the plateform after 2015. The current usage metrics is available 48-96 hours after online publication and is updated daily on week days.
Initial download of the metrics may take a while.