Fig. 10
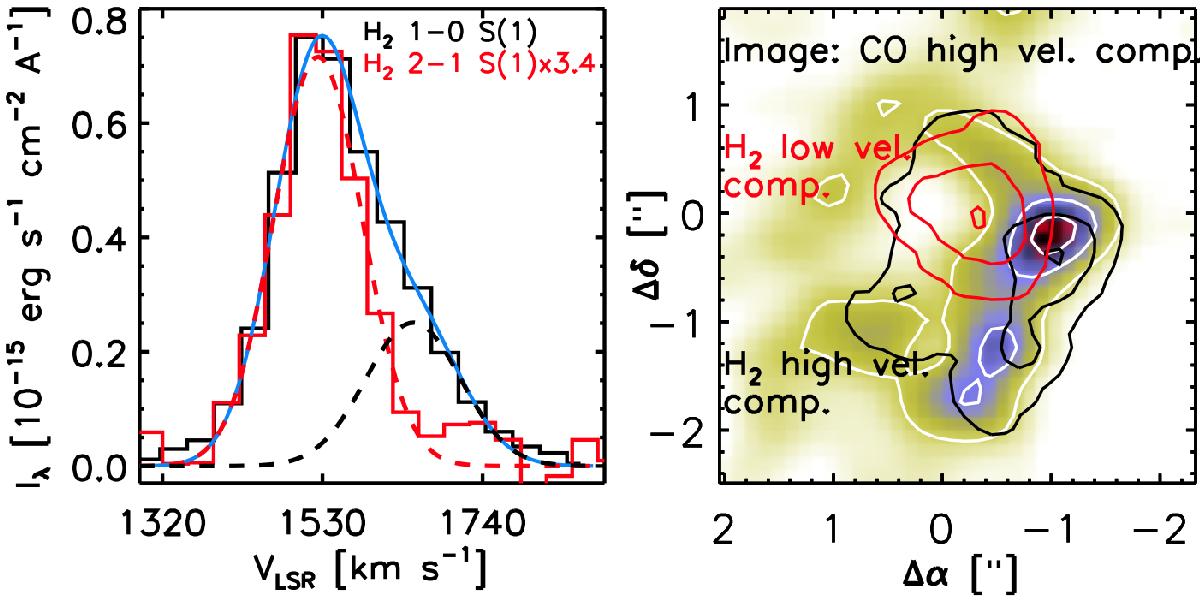
H2 2−1/1−0 S(1) ratio in SGMC 4/5. The left panel shows the spectra for the two near-IR H2 lines, H2 1−0 S(1) in solid-black and H2 2−1 S(1) in solid-red line scaled by a factor of 3.4. The dashed-red line is the Gaussian fit for the H2 2−1 S(1) line, while the blue-solid line is the fit for the H2 1−0 S(1) emission that corresponds to the addition of two Gaussian curves (the red and black dashed lines). The color image and white contours in the right panel show the integrated intensity of the high-velocity component observed in CO(3−2). Red and black contours are the H2 emission integrated in 1300–1512 km s-1 (low-velocity component) and 1580–1760 km s-1 (high-velocity component), respectively. Offset positions are as in Fig. 4.
Current usage metrics show cumulative count of Article Views (full-text article views including HTML views, PDF and ePub downloads, according to the available data) and Abstracts Views on Vision4Press platform.
Data correspond to usage on the plateform after 2015. The current usage metrics is available 48-96 hours after online publication and is updated daily on week days.
Initial download of the metrics may take a while.