Fig. 1
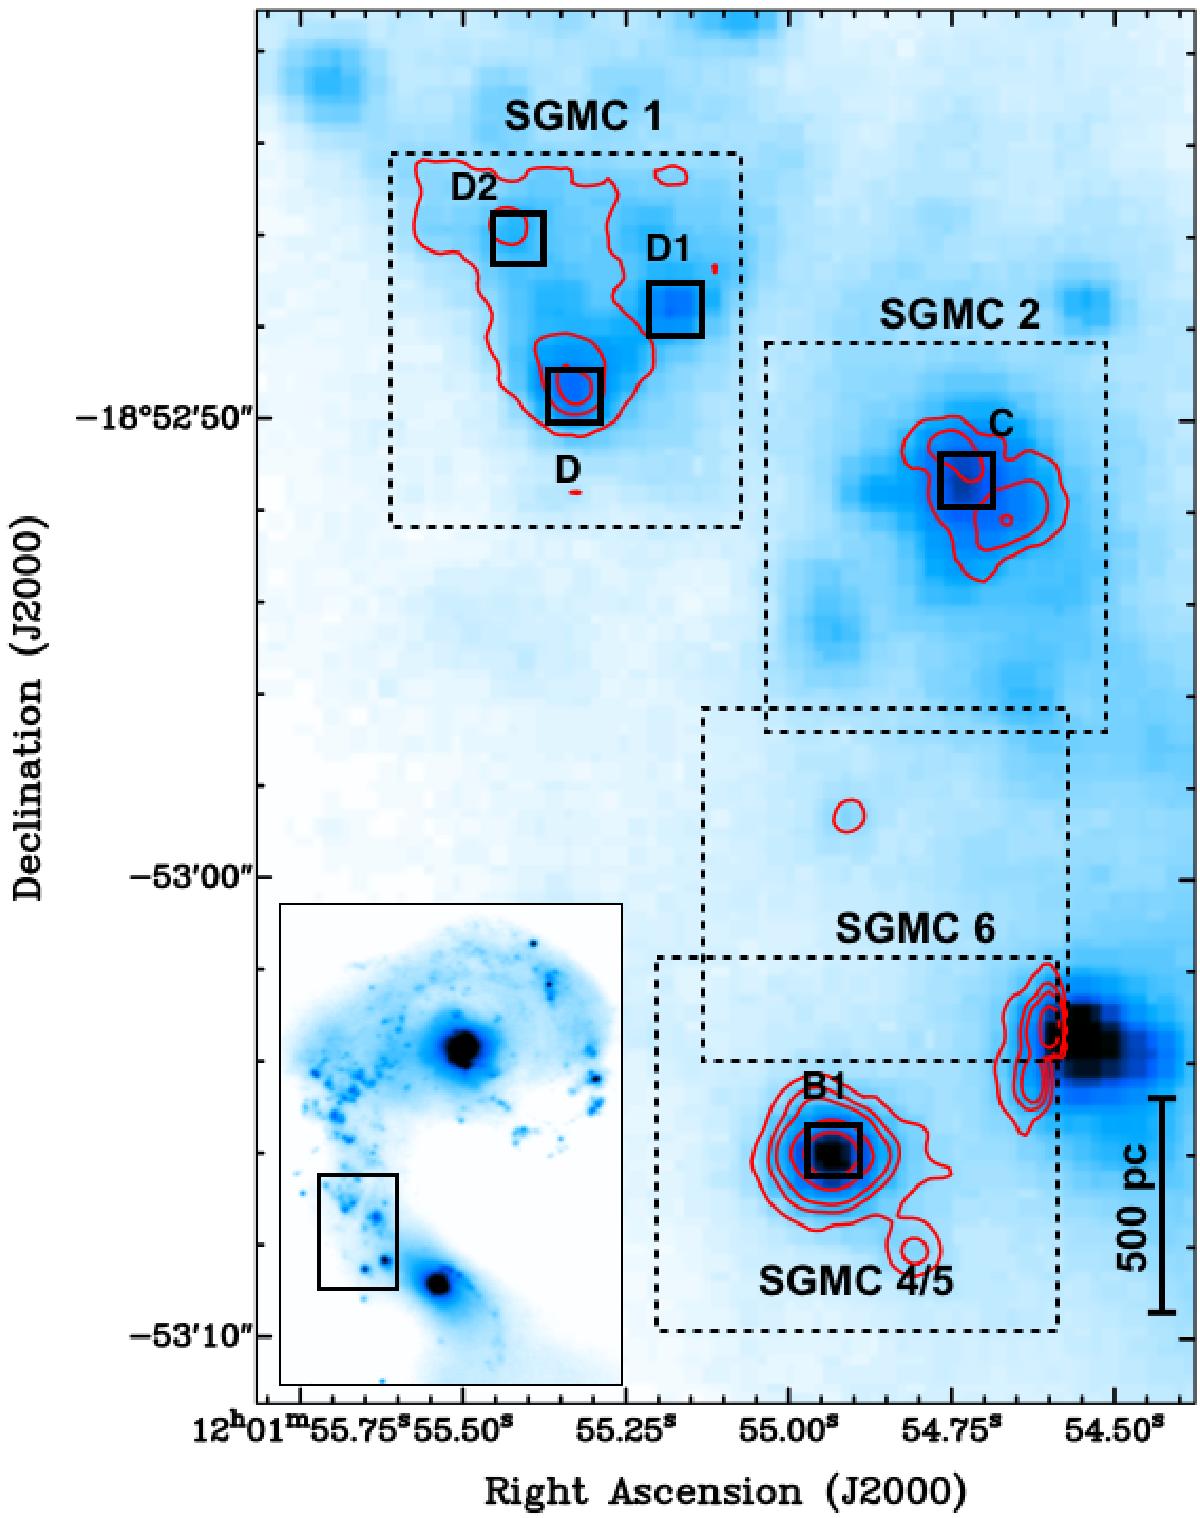
K-band emission from the overlap region obtained with the CFHT (Herrera et al. 2011) overlaid with Brγ contours from the SINFONI observations. Small black squares highlight the position of the SSCs lying within the four SINFONI FOVs, which are marked with dashed boxes. An inserted image of the Antennae galaxies shows, in a black rectangle, the relative position of the overlap region in the merger.
Current usage metrics show cumulative count of Article Views (full-text article views including HTML views, PDF and ePub downloads, according to the available data) and Abstracts Views on Vision4Press platform.
Data correspond to usage on the plateform after 2015. The current usage metrics is available 48-96 hours after online publication and is updated daily on week days.
Initial download of the metrics may take a while.