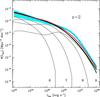
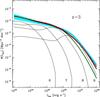
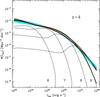
Fig. 7
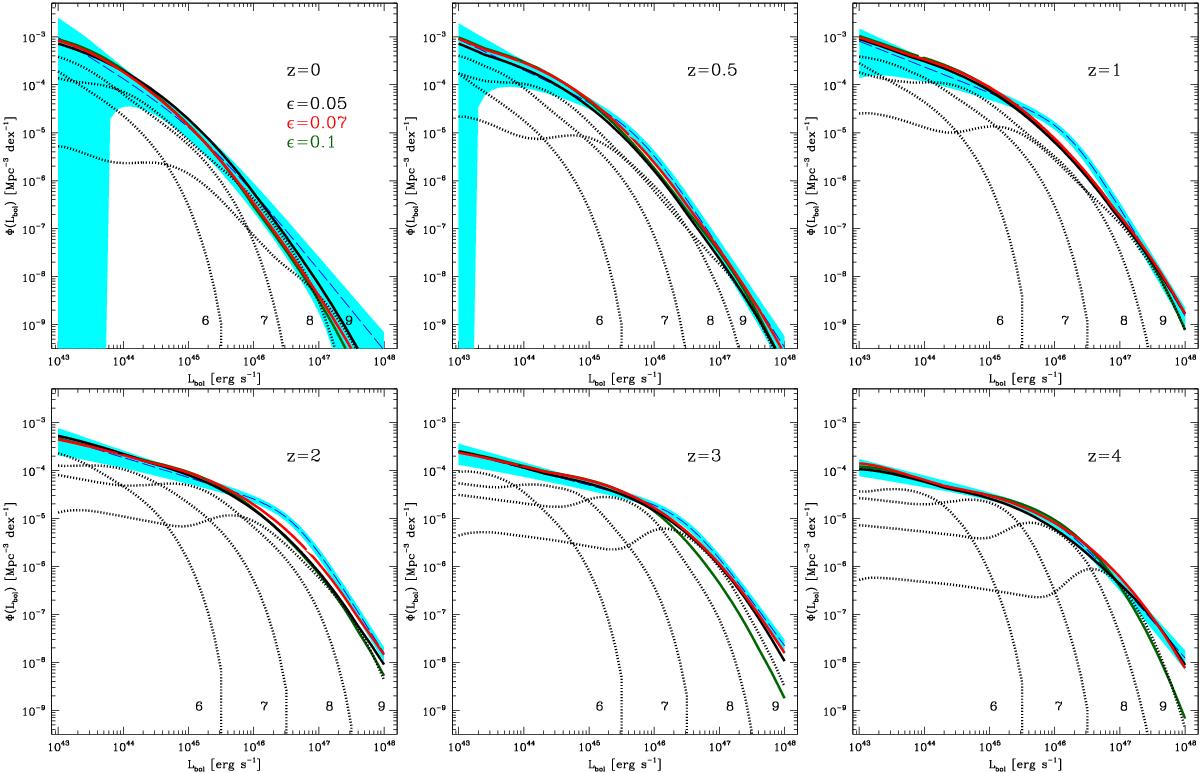
Bolometric quasar luminosity function at different redshifts predicted by the models (solid black, red, and green lines for ϵ = 0.05, 0.07, and 0.1, respectively), and compared with the estimates from Hopkins et al. (2007, blue dashed lines plus cyan shaded areas for the 1σ uncertainty). Black dotted lines show the contribution to the LF from SMBHs with mass in the interval indicated in the plots (e.g., “6” corresponds to a mass interval [ 5 × 10⁵, 5 × 10⁶) M⊙) for the model with ϵ = 0.05.
Current usage metrics show cumulative count of Article Views (full-text article views including HTML views, PDF and ePub downloads, according to the available data) and Abstracts Views on Vision4Press platform.
Data correspond to usage on the plateform after 2015. The current usage metrics is available 48-96 hours after online publication and is updated daily on week days.
Initial download of the metrics may take a while.