Free Access
Fig. 5
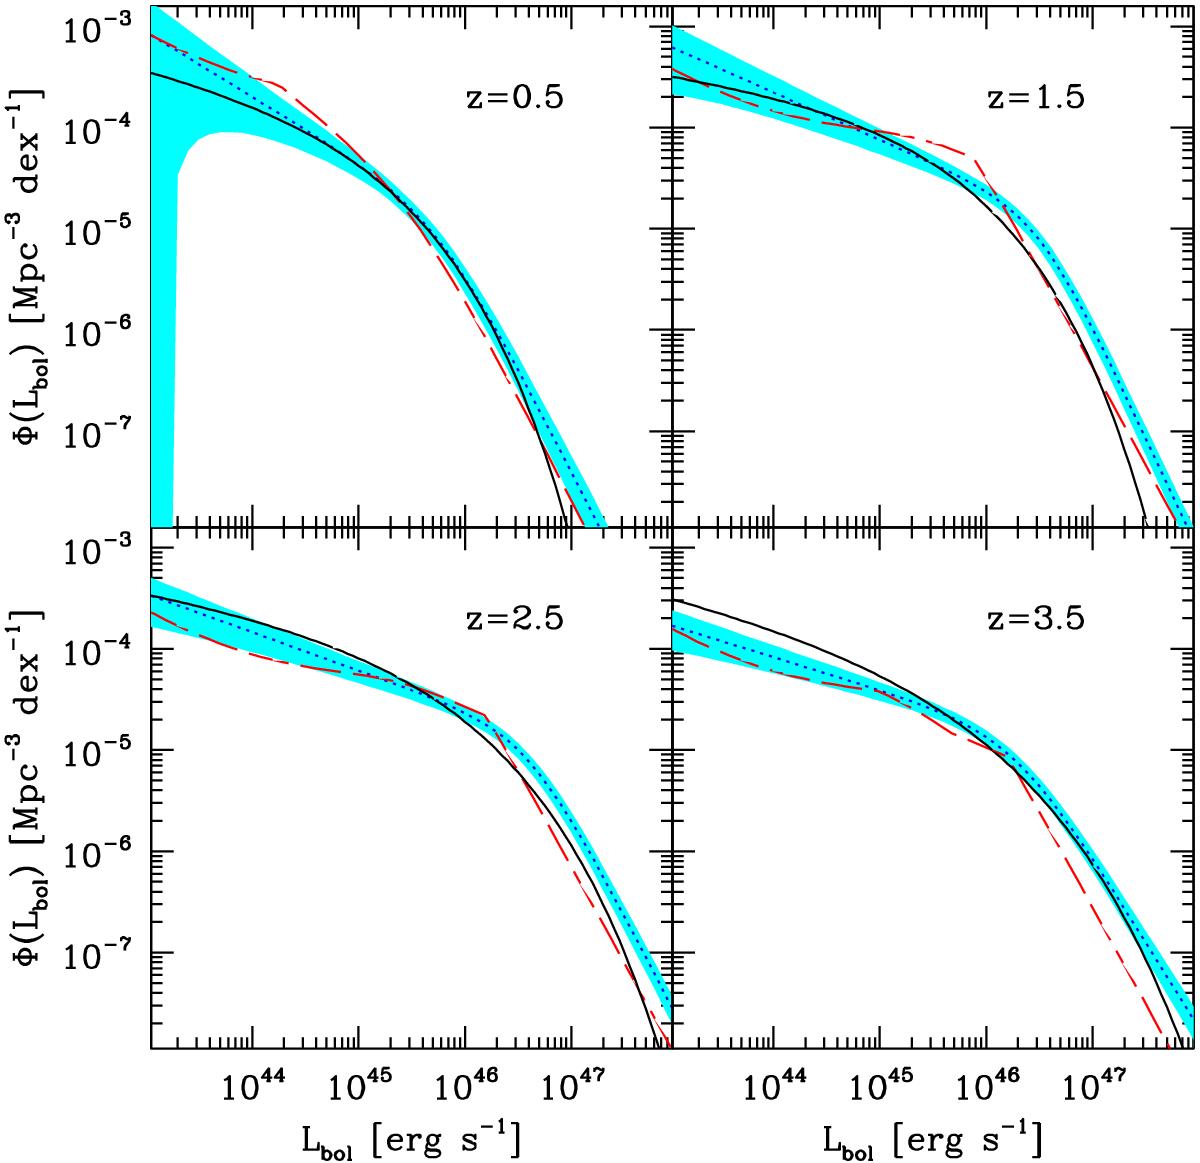
Bolometric luminosity function of quasars at different redshifts from: Hopkins et al. (2007, blue dotted lines plus cyan shaded areas for the 1σ; Ueda et al. (2014, red dashed lines); and by Aversa et al. (2015, black solid lines).
Current usage metrics show cumulative count of Article Views (full-text article views including HTML views, PDF and ePub downloads, according to the available data) and Abstracts Views on Vision4Press platform.
Data correspond to usage on the plateform after 2015. The current usage metrics is available 48-96 hours after online publication and is updated daily on week days.
Initial download of the metrics may take a while.