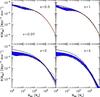
Fig. A.3

Mass function of SMBHs (top panel) and AGN (bottom panel) obtained after changing the Eddington ratio distribution. Lines are for following cases: (1) we use a truncated power law for P(λ) of type-1 AGN (red short dashed lines); (2) a power-law distribution for type-2 AGN with constant slope αλ = −0.6 (black solid lines); (3) a faster evolving power-law distribution (αλ = −0.6/(0.4 + z)1.5) for type-2 AGN (green long dashed lines). Shaded areas are for the uncertainty of the model as in Fig. A.2.
Current usage metrics show cumulative count of Article Views (full-text article views including HTML views, PDF and ePub downloads, according to the available data) and Abstracts Views on Vision4Press platform.
Data correspond to usage on the plateform after 2015. The current usage metrics is available 48-96 hours after online publication and is updated daily on week days.
Initial download of the metrics may take a while.