Fig. 12
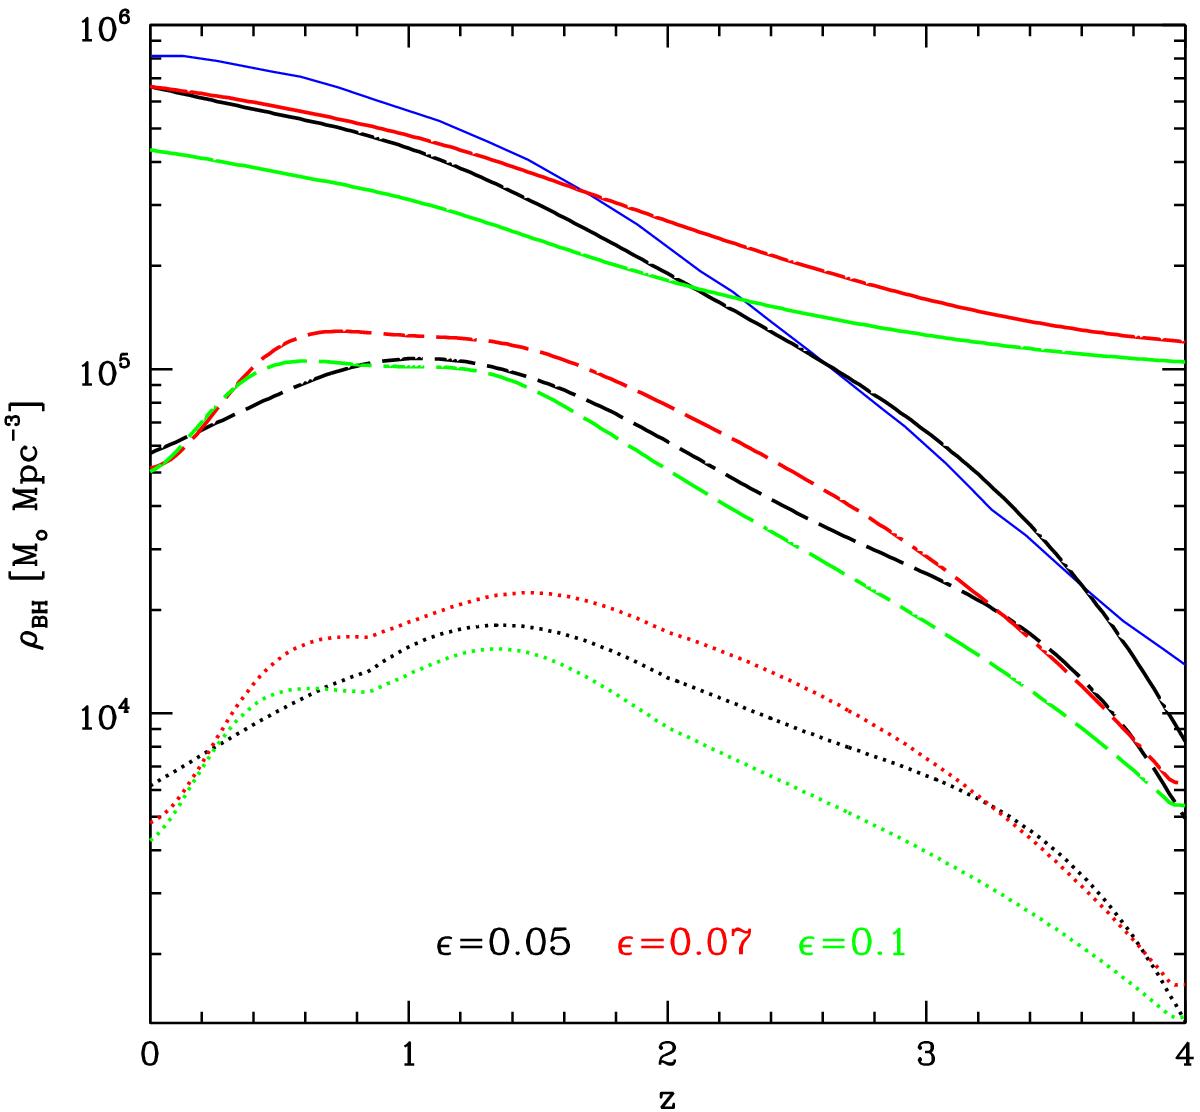
Mass density of SMBHs (solid lines), active SMBHs (dashed lines), and type-1 AGN (dotted lines) for the three values of the radiative efficiency indicated in the plot. The thin blue solid line corresponds to results from Ueda et al. (2014). If ϵ = 0.1 or 0.07, the evolution of the mass density is relatively modest. On the contrary, if ϵ = 0.05, the mass density at z = 4 is two orders of magnitude lower than the local one. The AGN mass density has similar evolution for the three cases, with a peak at approximately z = 0.5–1.5.
Current usage metrics show cumulative count of Article Views (full-text article views including HTML views, PDF and ePub downloads, according to the available data) and Abstracts Views on Vision4Press platform.
Data correspond to usage on the plateform after 2015. The current usage metrics is available 48-96 hours after online publication and is updated daily on week days.
Initial download of the metrics may take a while.