Fig. 5
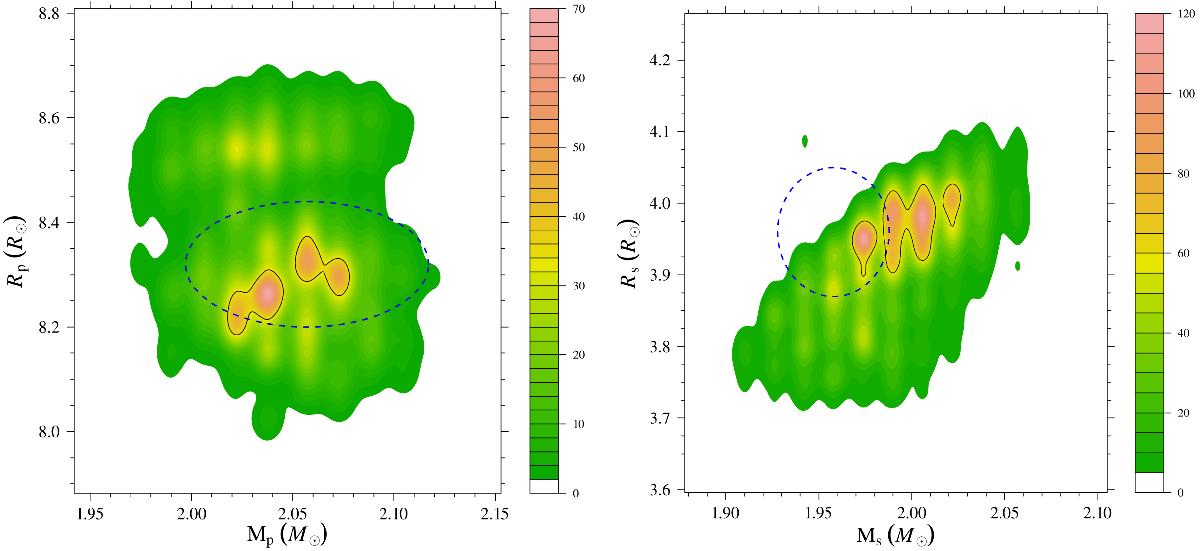
Left: 2D density of probability for the best-fit mass and radius for the primary star. The blue-dashed ellipse marks the 1σ uncertainty on the observational values. The results were obtained relying on a multi-mass grid, with errors on the stellar masses from Andersen (1991) (see text). Right: same as in the left panel, but for the secondary star.
Current usage metrics show cumulative count of Article Views (full-text article views including HTML views, PDF and ePub downloads, according to the available data) and Abstracts Views on Vision4Press platform.
Data correspond to usage on the plateform after 2015. The current usage metrics is available 48-96 hours after online publication and is updated daily on week days.
Initial download of the metrics may take a while.