Fig. 7
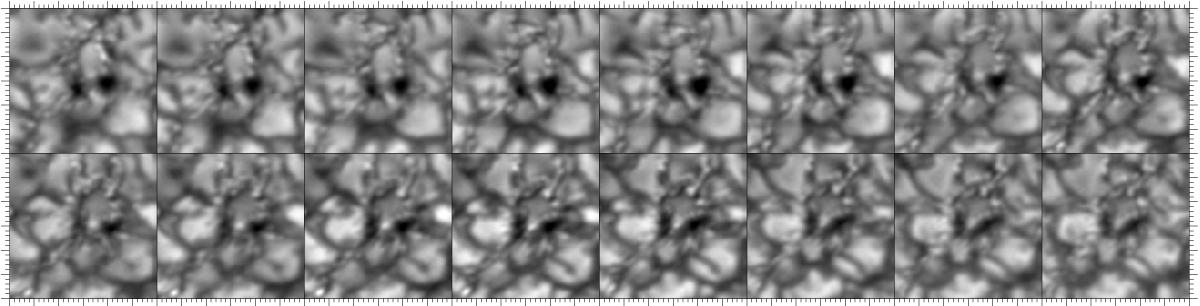
Temporal evolution of micro-pores shown at 34-s intervals starting at 08:07 UT (top-left to bottom-right). The ROI is 6″ × 6″ as indicated by the white square in Fig. 1. Major tick marks are separated by one arcsecond. All images are from the reconstructed broadband channel and are displayed in the same intensity range of 0.75–1.35 I0.
Current usage metrics show cumulative count of Article Views (full-text article views including HTML views, PDF and ePub downloads, according to the available data) and Abstracts Views on Vision4Press platform.
Data correspond to usage on the plateform after 2015. The current usage metrics is available 48-96 hours after online publication and is updated daily on week days.
Initial download of the metrics may take a while.