Fig. 2
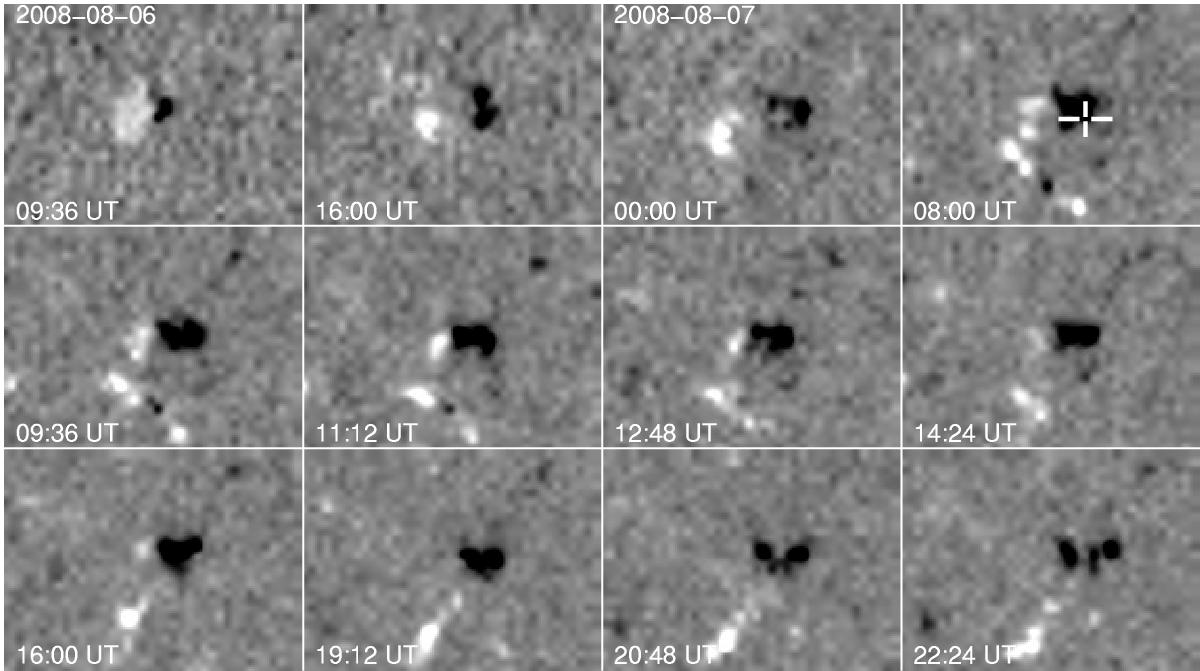
SoHO/MDI time series of a small EFR on 2008 August 6 and 7. Each panel has the same size as the high-resolution image in Fig. 1. The magnetograms were scaled between ±100 G and resampled to a four times finer grid for better display. The cross ✛’ indicates the position of the micro-pores in Fig. 1 using the magnetogram closest in time.
Current usage metrics show cumulative count of Article Views (full-text article views including HTML views, PDF and ePub downloads, according to the available data) and Abstracts Views on Vision4Press platform.
Data correspond to usage on the plateform after 2015. The current usage metrics is available 48-96 hours after online publication and is updated daily on week days.
Initial download of the metrics may take a while.