Fig. 16
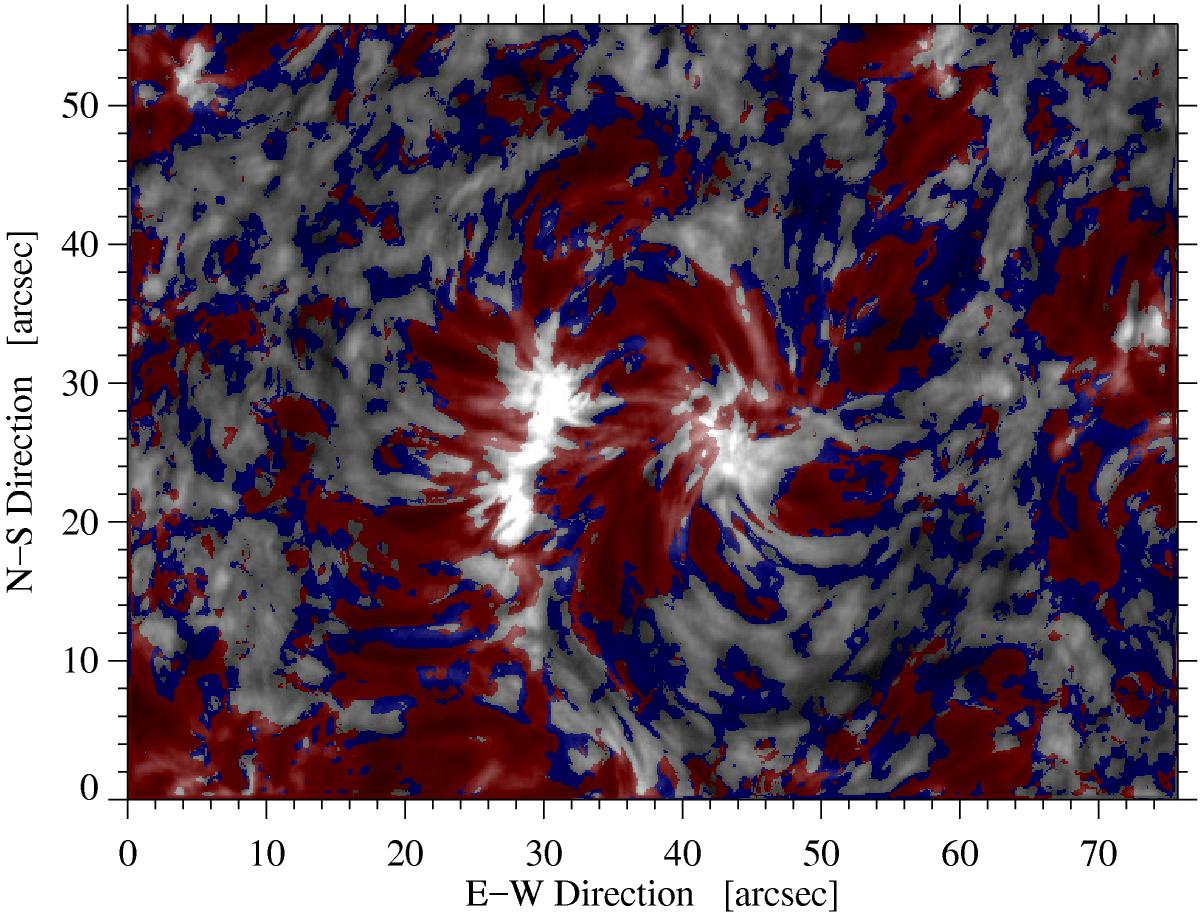
Two-dimensional map containing the locations of the two clusters c1 (blue) and c2 (red), which were identified in the cluster analysis assuming that the histograms of the CM parameters contain only two distinct populations. The Hα line-core intensity image of Fig. 1 serves as the background. The gray areas indicate the same regions as in Fig. 12, where the CM inversions result in mediocre fits.
Current usage metrics show cumulative count of Article Views (full-text article views including HTML views, PDF and ePub downloads, according to the available data) and Abstracts Views on Vision4Press platform.
Data correspond to usage on the plateform after 2015. The current usage metrics is available 48-96 hours after online publication and is updated daily on week days.
Initial download of the metrics may take a while.