Fig. 13
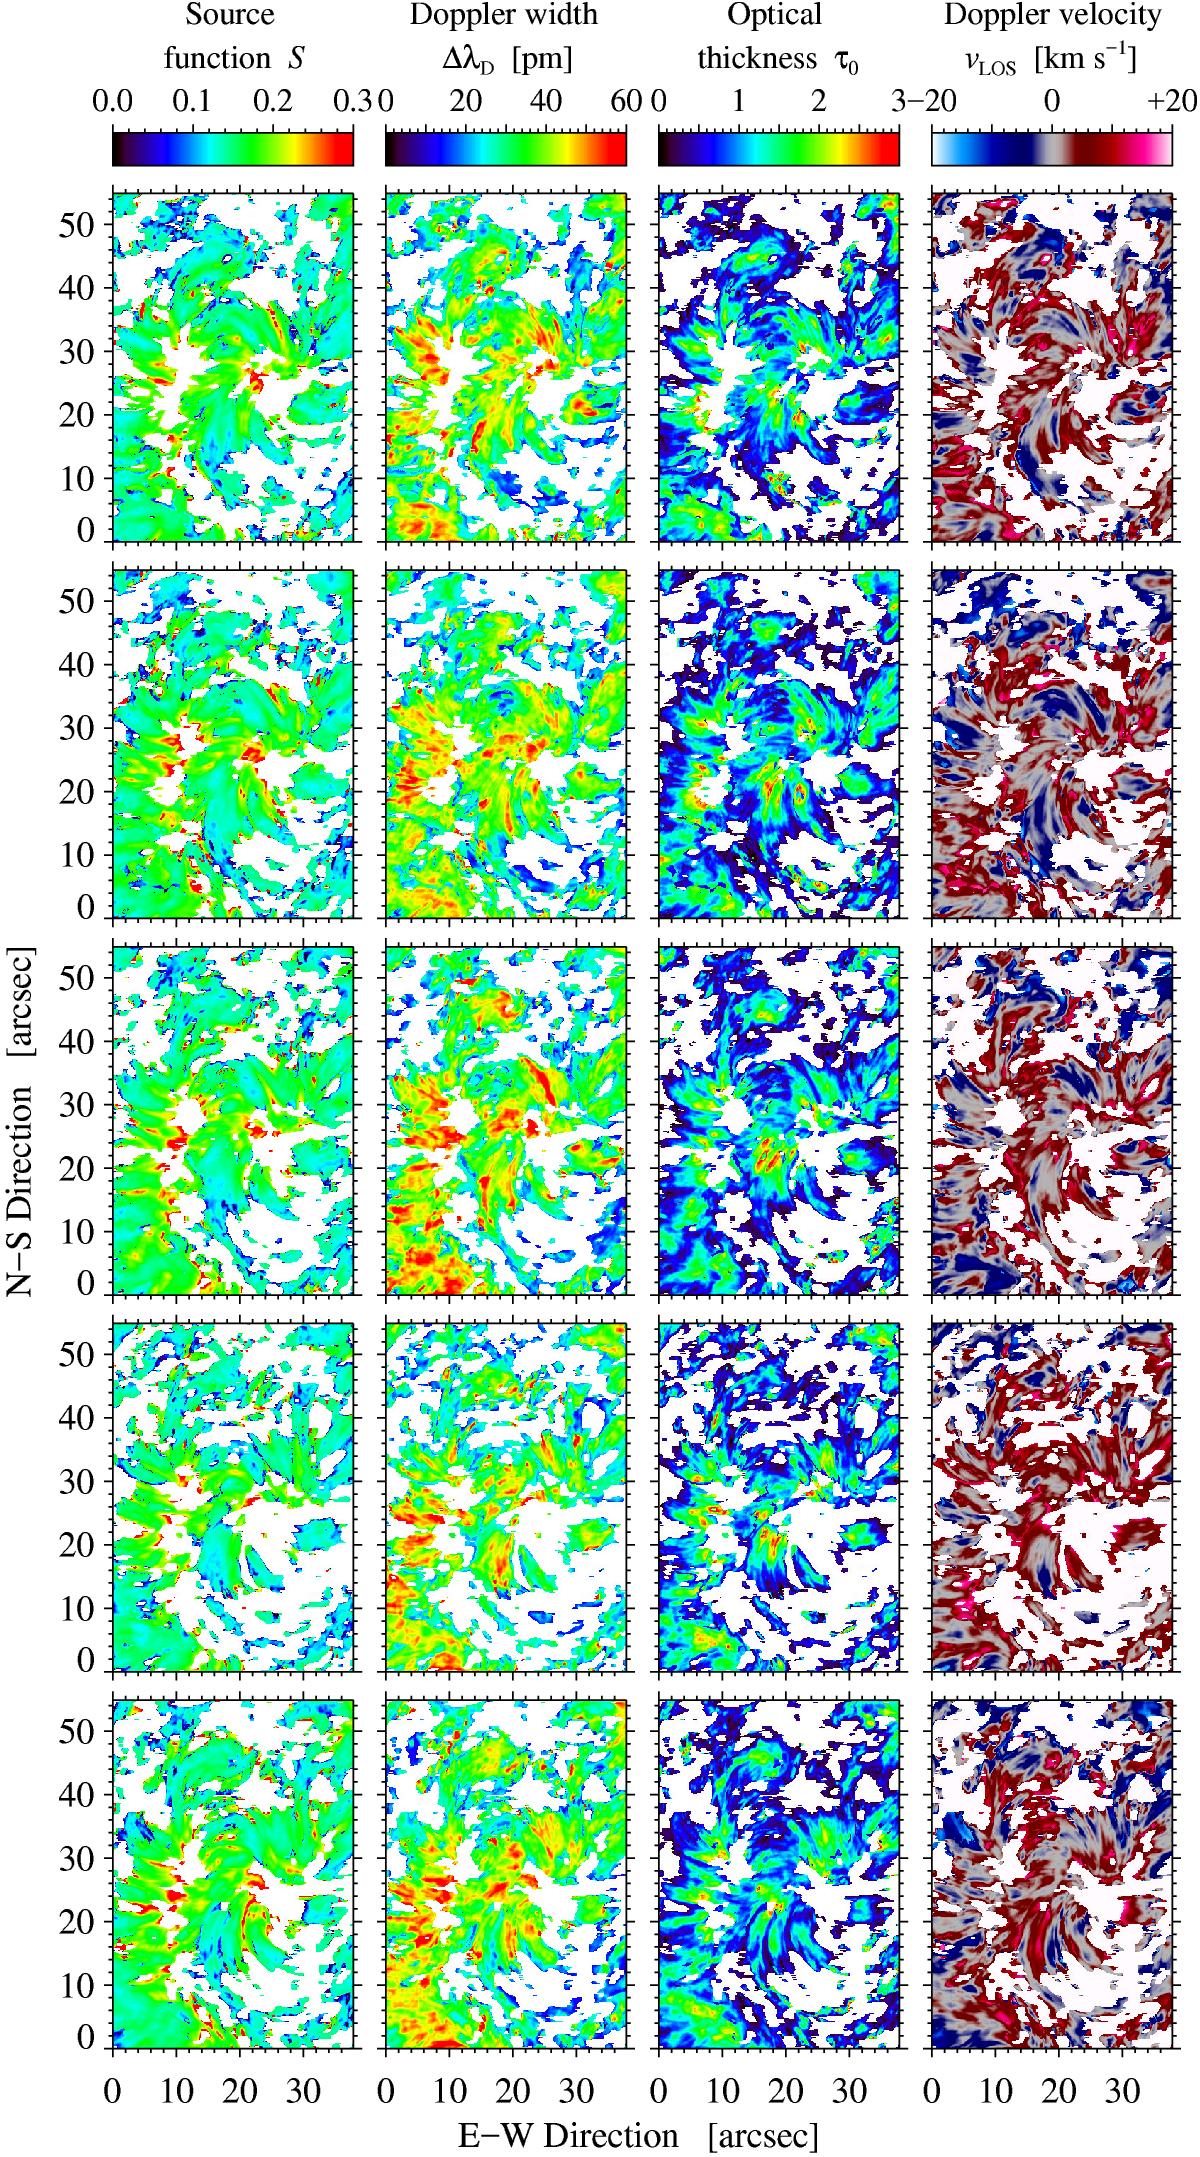
Temporal evolution of CM parameters (top to bottom) for the ROI containing the EFR and AFS. The maps are depicted at 136-s intervals starting at 08:07 UT (see Fig. 12) and show source function S, Doppler width ΔλD, optical thickness τ0, and LOS velocity vLOS (left to right). The two white vertical lines in the upper-left panel shown in Fig. 12 enclose the FOV of this figure.
Current usage metrics show cumulative count of Article Views (full-text article views including HTML views, PDF and ePub downloads, according to the available data) and Abstracts Views on Vision4Press platform.
Data correspond to usage on the plateform after 2015. The current usage metrics is available 48-96 hours after online publication and is updated daily on week days.
Initial download of the metrics may take a while.