Fig. 12
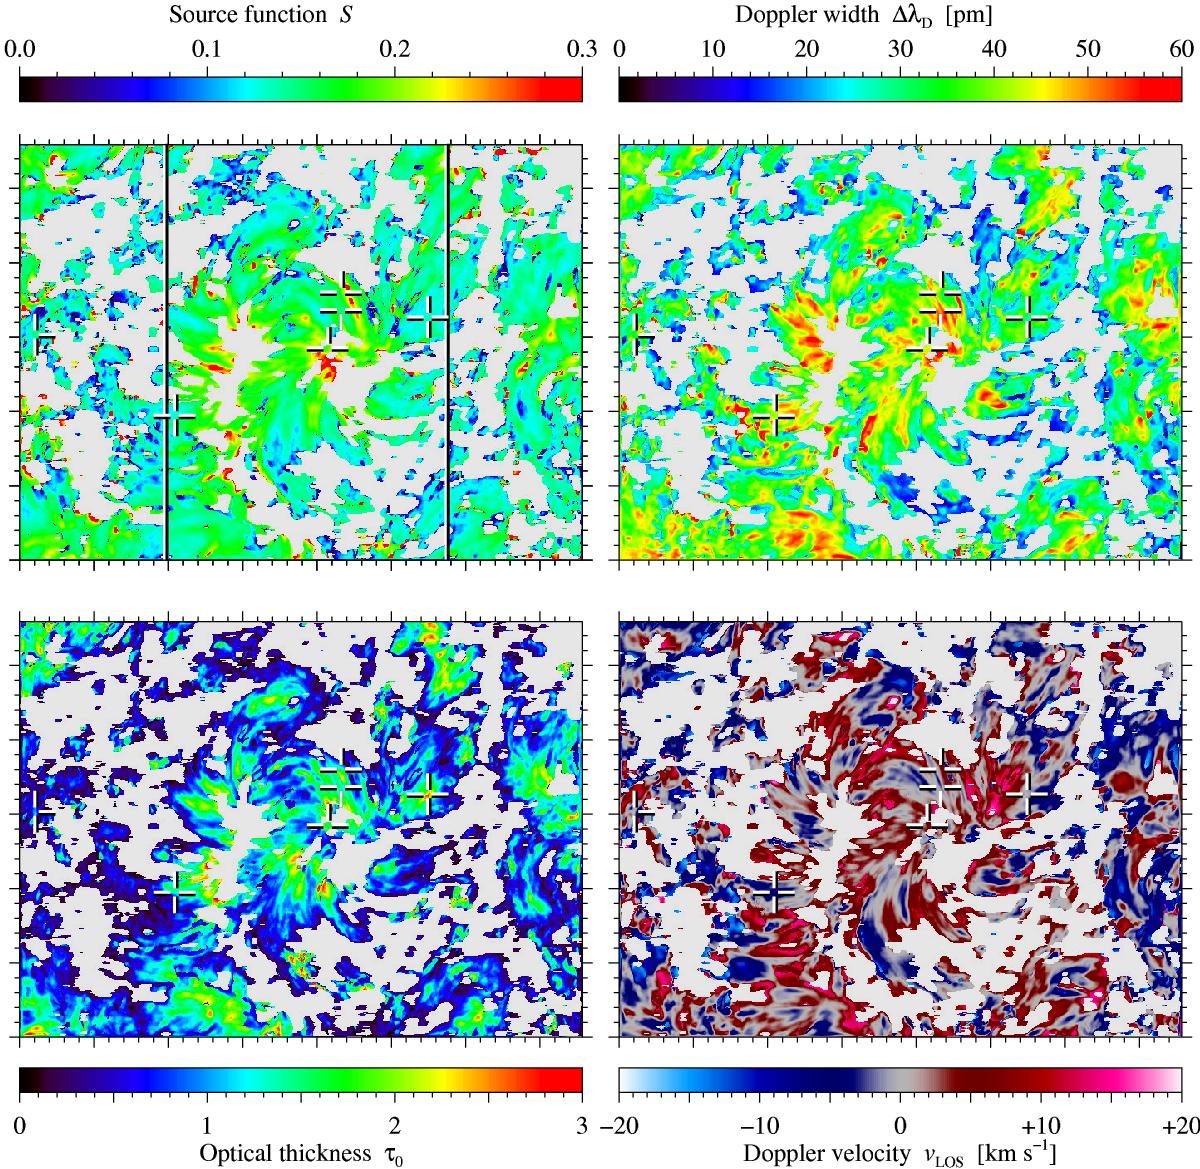
Maps of CM parameters for the inverted Hα contrast profiles corresponding to Fig. 1, i.e., source function S, Doppler width ΔλD, optical thickness τ0, and LOS velocity vLOS (top-left to bottom-right). Light gray areas indicate regions, where the CM inversions did not deliver good fits. The two white vertical lines in the upper-left panel enclose the ROI, which was selected to show the evolution of the AFS in Fig. 13. The FOV is the same as shown in Fig. 1.
Current usage metrics show cumulative count of Article Views (full-text article views including HTML views, PDF and ePub downloads, according to the available data) and Abstracts Views on Vision4Press platform.
Data correspond to usage on the plateform after 2015. The current usage metrics is available 48-96 hours after online publication and is updated daily on week days.
Initial download of the metrics may take a while.