Fig. 1
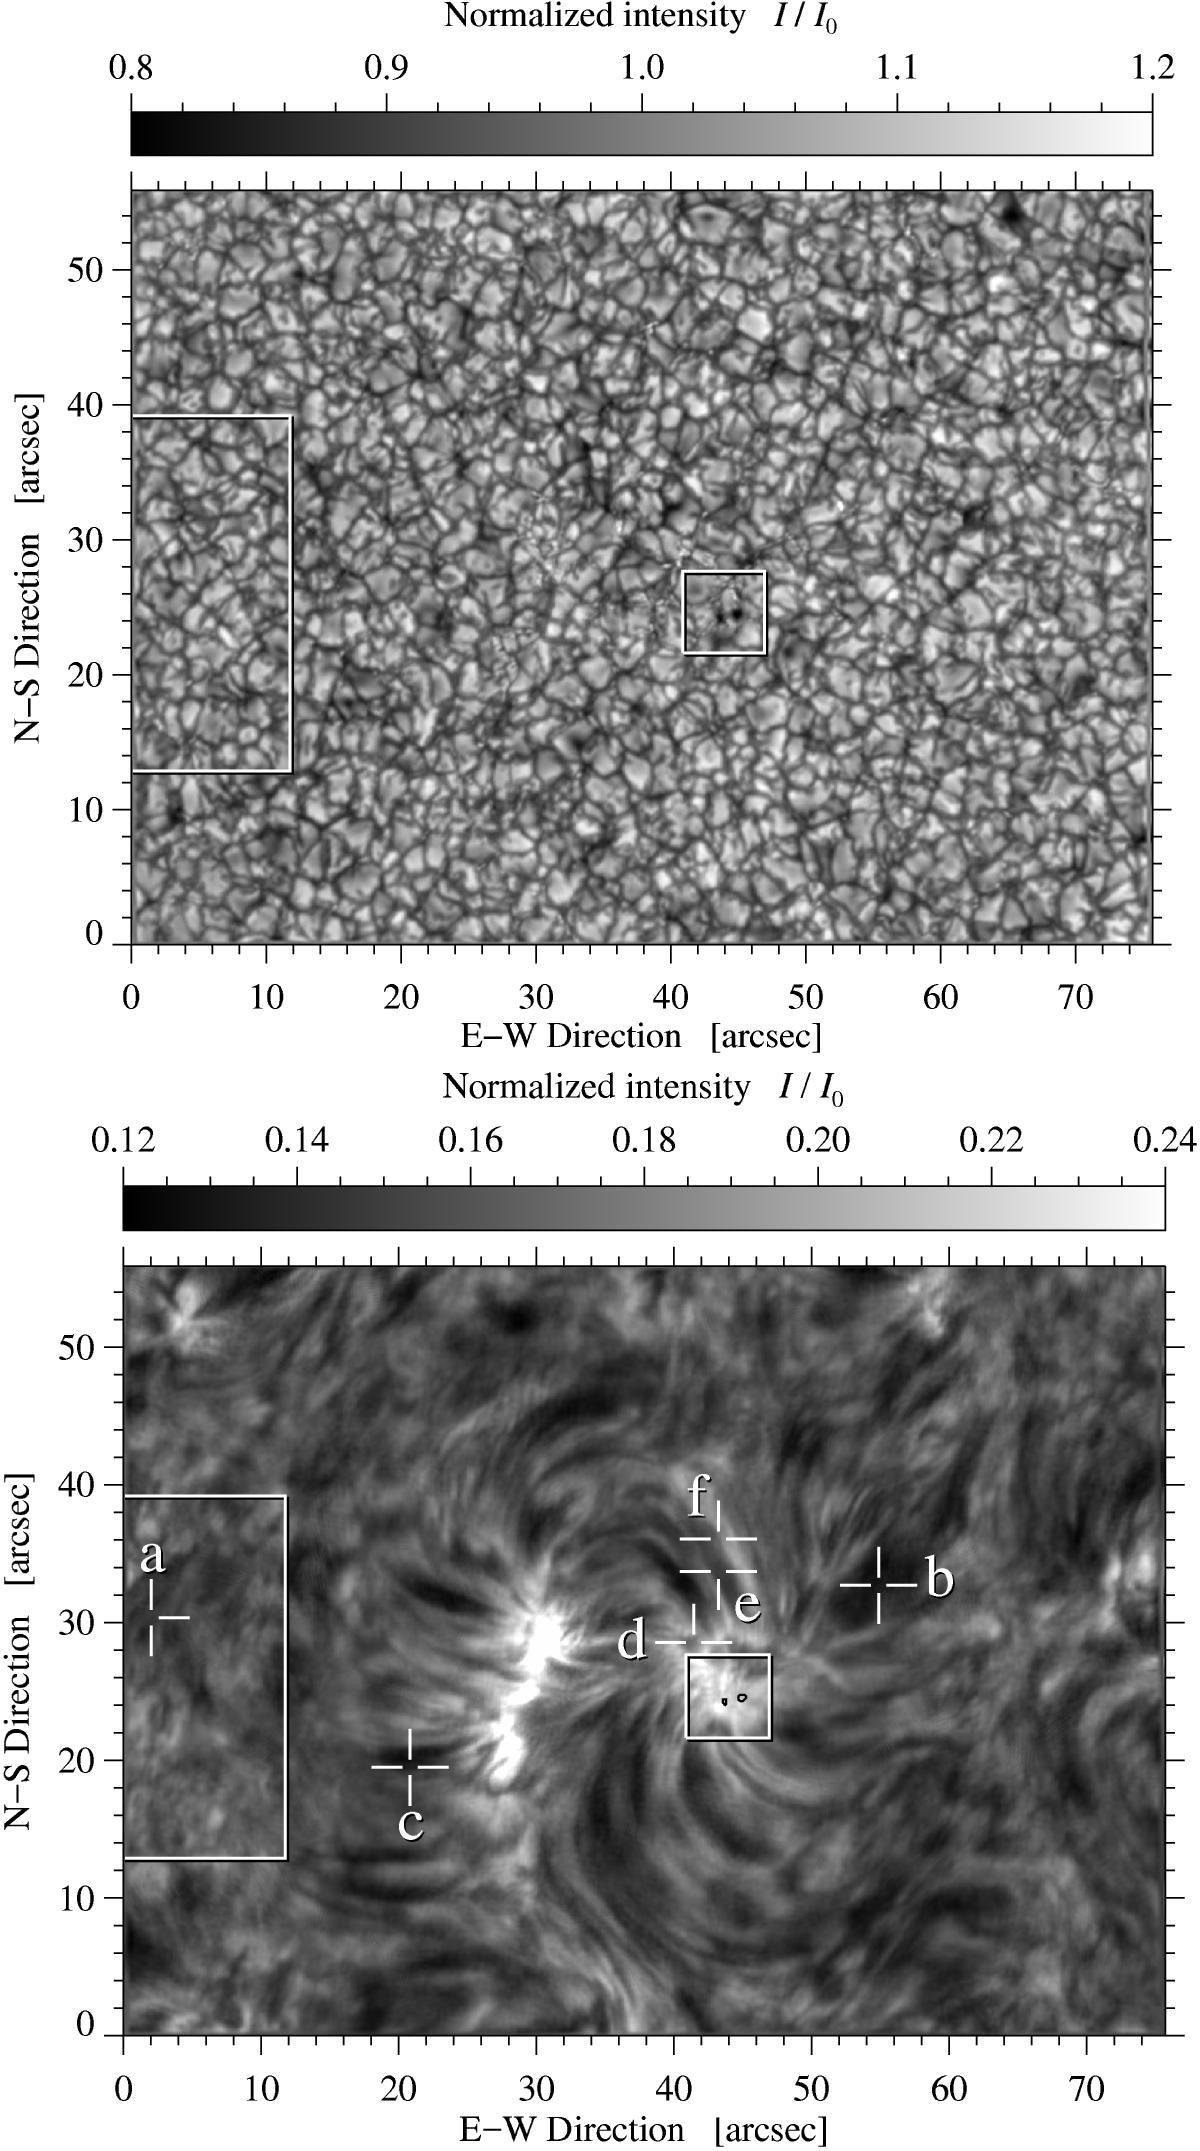
MOMFBD-restored broadband image (top) at about λ600 nm of micro-pores (white square in the center in both images) in an EFR observed with the GFPI at 08:07 UT on 2008 August 7. Hα line-core intensity image corresponding to the broadband image (bottom). The white rectangle on the left outlines the region used for computing the average Hα quiet-Sun spectral profile. Crosses “✛” and alphabetic labels mark the locations of six contrast profiles plotted in Fig. 5. The black contours indicate the position of the micro-pores.
Current usage metrics show cumulative count of Article Views (full-text article views including HTML views, PDF and ePub downloads, according to the available data) and Abstracts Views on Vision4Press platform.
Data correspond to usage on the plateform after 2015. The current usage metrics is available 48-96 hours after online publication and is updated daily on week days.
Initial download of the metrics may take a while.