Fig. 5
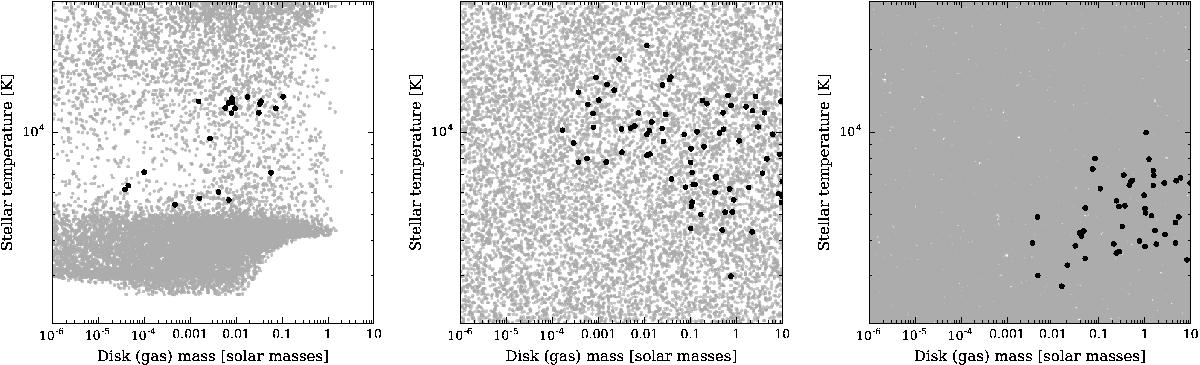
Comparison of parameter space coverage of all the models (gray points) and best fits to the source shown in Fig. 4 (black) for the R06 model grid (left), the subset of models presented in this paper that are in the sp–s-i set (center), and the spubhmi set (right). The good fits are defined using Eq. (20), and we apply the same criterion to the R06 models. The limits are adjusted to those covered by the new model sets, and the left figure would include more points on the left and higher temperatures if the plot limits were expanded. While the disk masses sampled for the new models were dust masses, these have been converted to gas masses for the above figures assuming a gas-to-dust ratio of 100.
Current usage metrics show cumulative count of Article Views (full-text article views including HTML views, PDF and ePub downloads, according to the available data) and Abstracts Views on Vision4Press platform.
Data correspond to usage on the plateform after 2015. The current usage metrics is available 48-96 hours after online publication and is updated daily on week days.
Initial download of the metrics may take a while.