Fig. 1
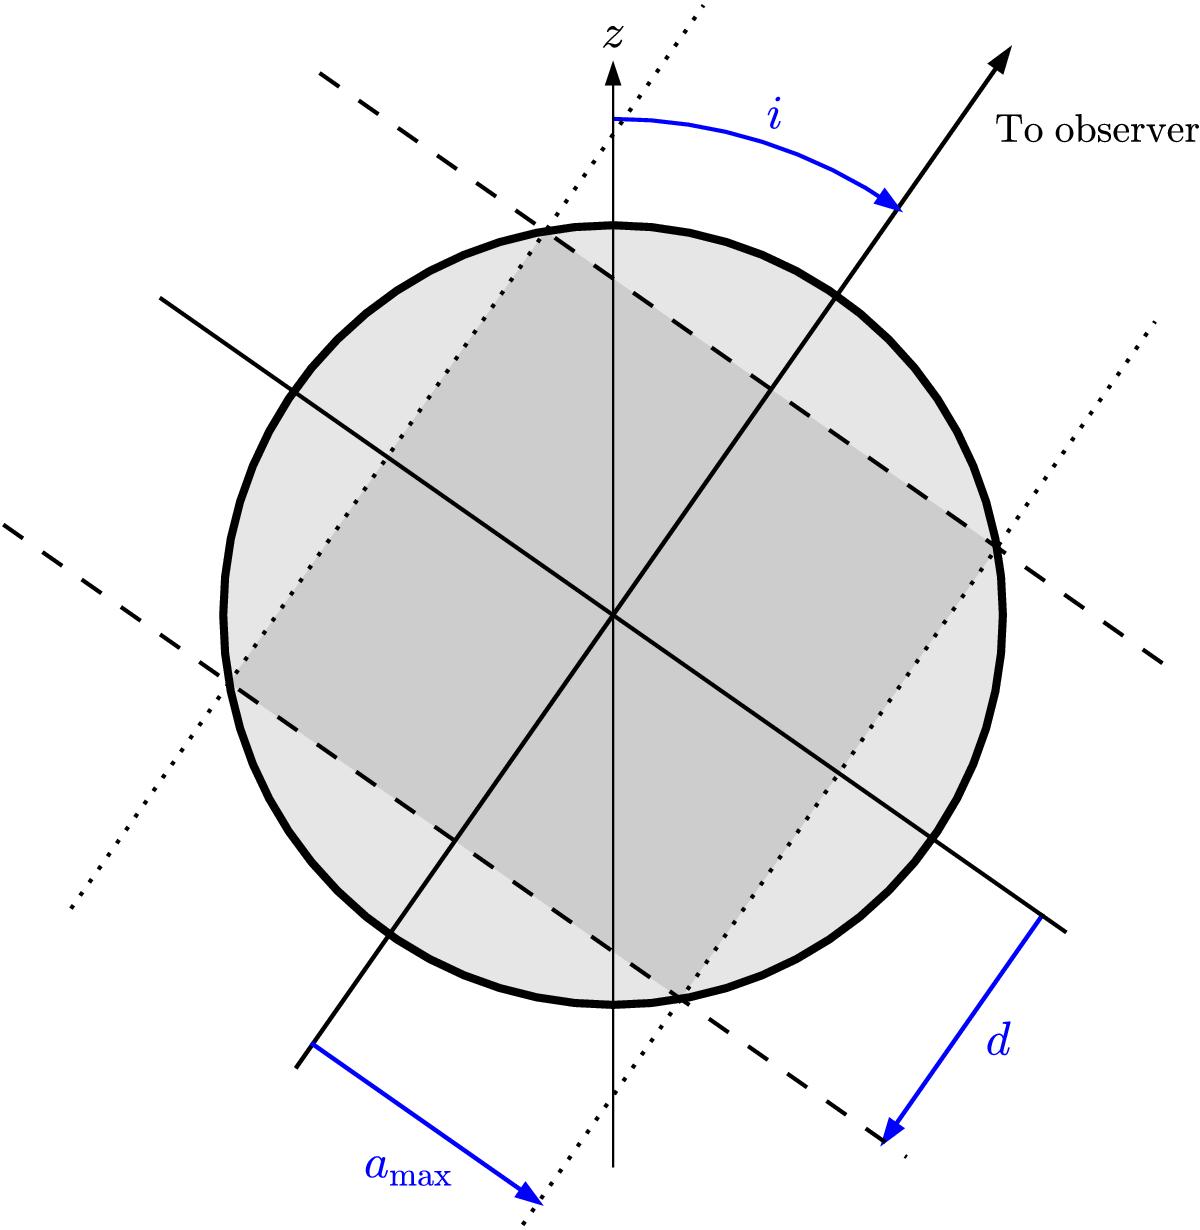
Schematic representation of a typical model. The z axis of the model is shown as the black vertical arrow. In this example, the line of sight is rotated by an inclination of i = 35° relative to the z axis. The dotted lines show the extent of the largest aperture with radius amax, while the dashed lines show the extent of the slab with half-width d inside which photons are taken into account for the SED. To ensure that the models account for all the emission in the intersection of the largest aperture and the slab (the dark shaded area), the edge of the grid (the thick solid circle) needs to have a radius of ![]() .
.
Current usage metrics show cumulative count of Article Views (full-text article views including HTML views, PDF and ePub downloads, according to the available data) and Abstracts Views on Vision4Press platform.
Data correspond to usage on the plateform after 2015. The current usage metrics is available 48-96 hours after online publication and is updated daily on week days.
Initial download of the metrics may take a while.