Fig. 3
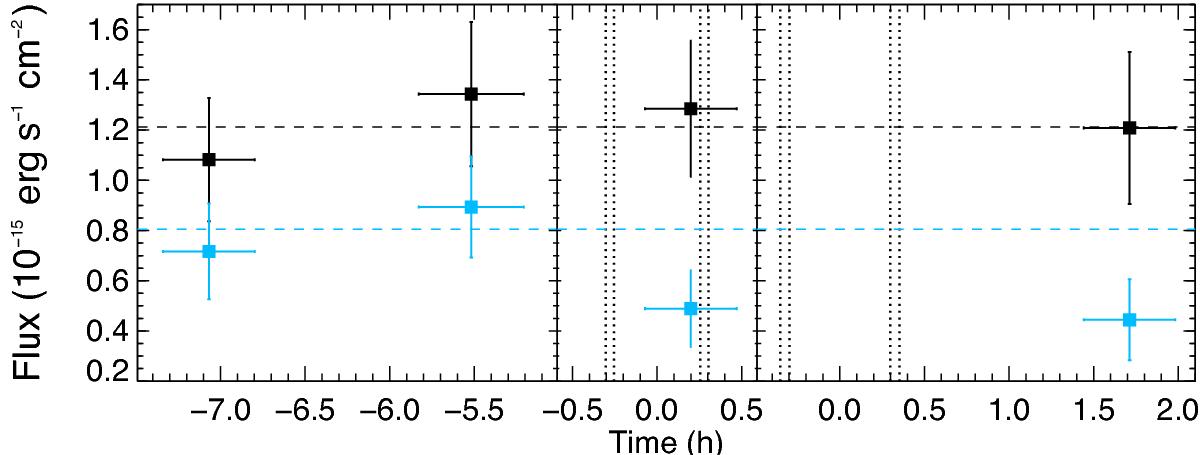
Ly-α line flux integrated over [−95; −55] km s-1 (blue points) and the complementary domain in [−210; 210] km s-1, airglow excluded (black points). The flux is normalized by the reference measurements in the left panel, and plotted as a function of time relative to the transit of TRAPPIST-1b (left and middle panels) and TRAPPIST-1c (right panel).
Current usage metrics show cumulative count of Article Views (full-text article views including HTML views, PDF and ePub downloads, according to the available data) and Abstracts Views on Vision4Press platform.
Data correspond to usage on the plateform after 2015. The current usage metrics is available 48-96 hours after online publication and is updated daily on week days.
Initial download of the metrics may take a while.