Fig. 2
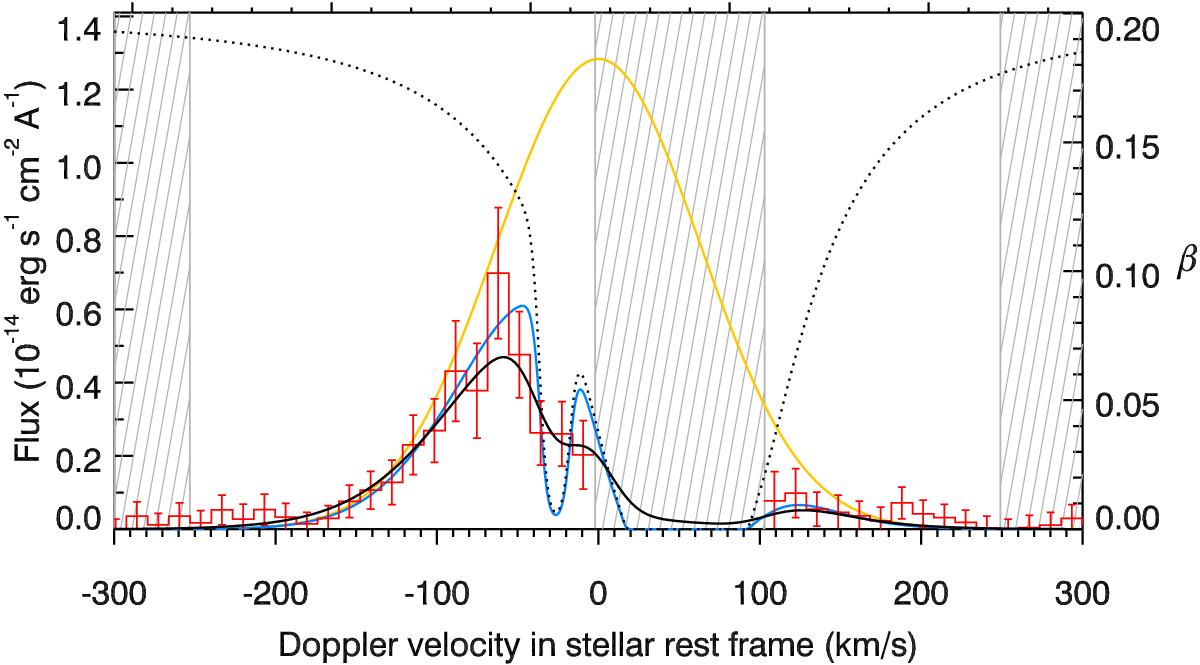
Intrinsic Ly-α line profile of TRAPPIST-1 (orange line). The solid blue line shows the Ly-α line profile after absorption by the ISM hydrogen and deuterium (dotted black line). The solid black line shows the line profile convolved with STIS LSF and compared to the observations shown as a red histogram. Hatched regions were excluded from the fit. The right axis shows the ratio β between radiation pressure and stellar gravity.
Current usage metrics show cumulative count of Article Views (full-text article views including HTML views, PDF and ePub downloads, according to the available data) and Abstracts Views on Vision4Press platform.
Data correspond to usage on the plateform after 2015. The current usage metrics is available 48-96 hours after online publication and is updated daily on week days.
Initial download of the metrics may take a while.