Fig. 9
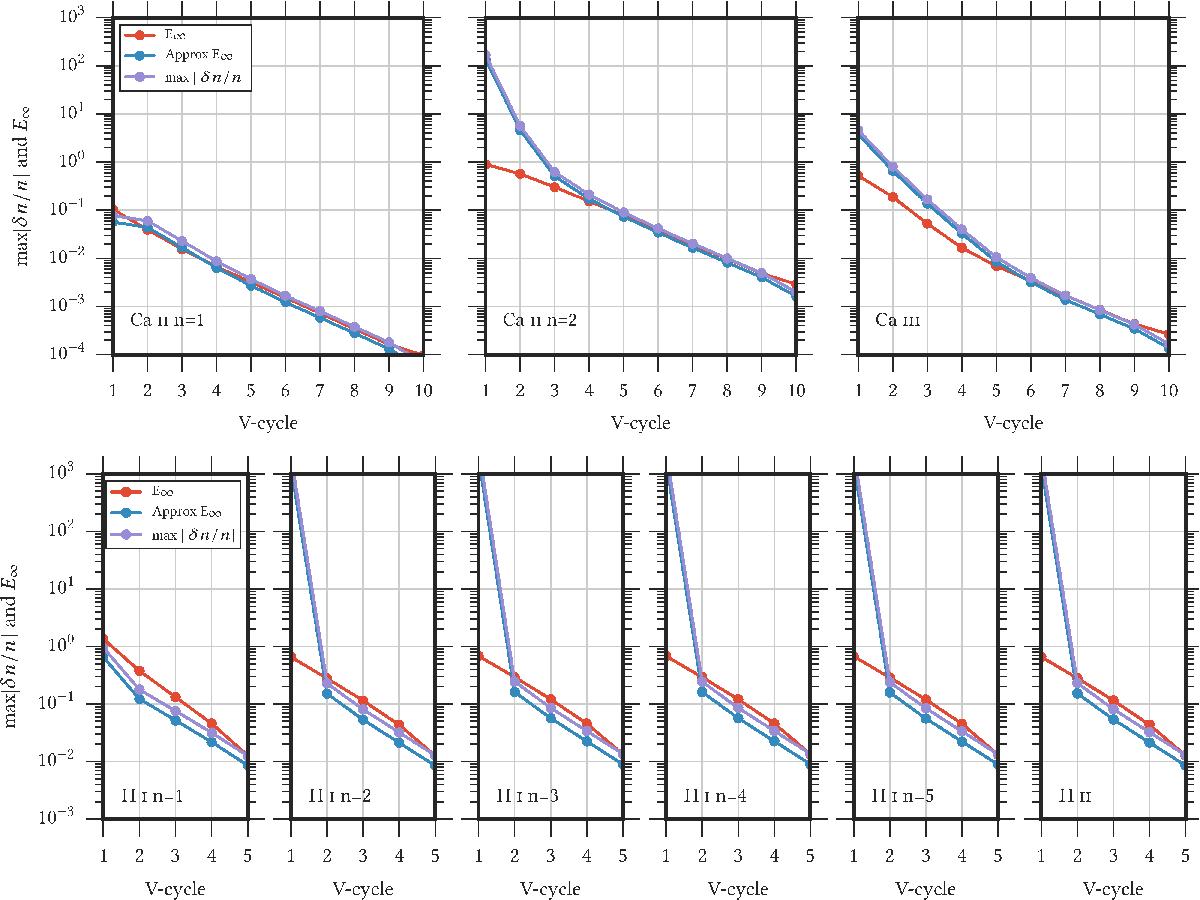
Convergence behavior of multigrid, showing the maximum relative error and the maximum relative error estimated by Eq. (18) for each V-cycle, as well as the maximum relative change in population per V-cycle. Upper panels: three-level Ca ii atom; lower panels: H i, both for atmosphere Model 1. For three-level Ca ii we used ν1 = 2, ν2 = 2, ν3 = 32 and for H i, we used ν0 = 15, ν1 = 2, ν2 = 25, ν3 = 32.
Current usage metrics show cumulative count of Article Views (full-text article views including HTML views, PDF and ePub downloads, according to the available data) and Abstracts Views on Vision4Press platform.
Data correspond to usage on the plateform after 2015. The current usage metrics is available 48-96 hours after online publication and is updated daily on week days.
Initial download of the metrics may take a while.