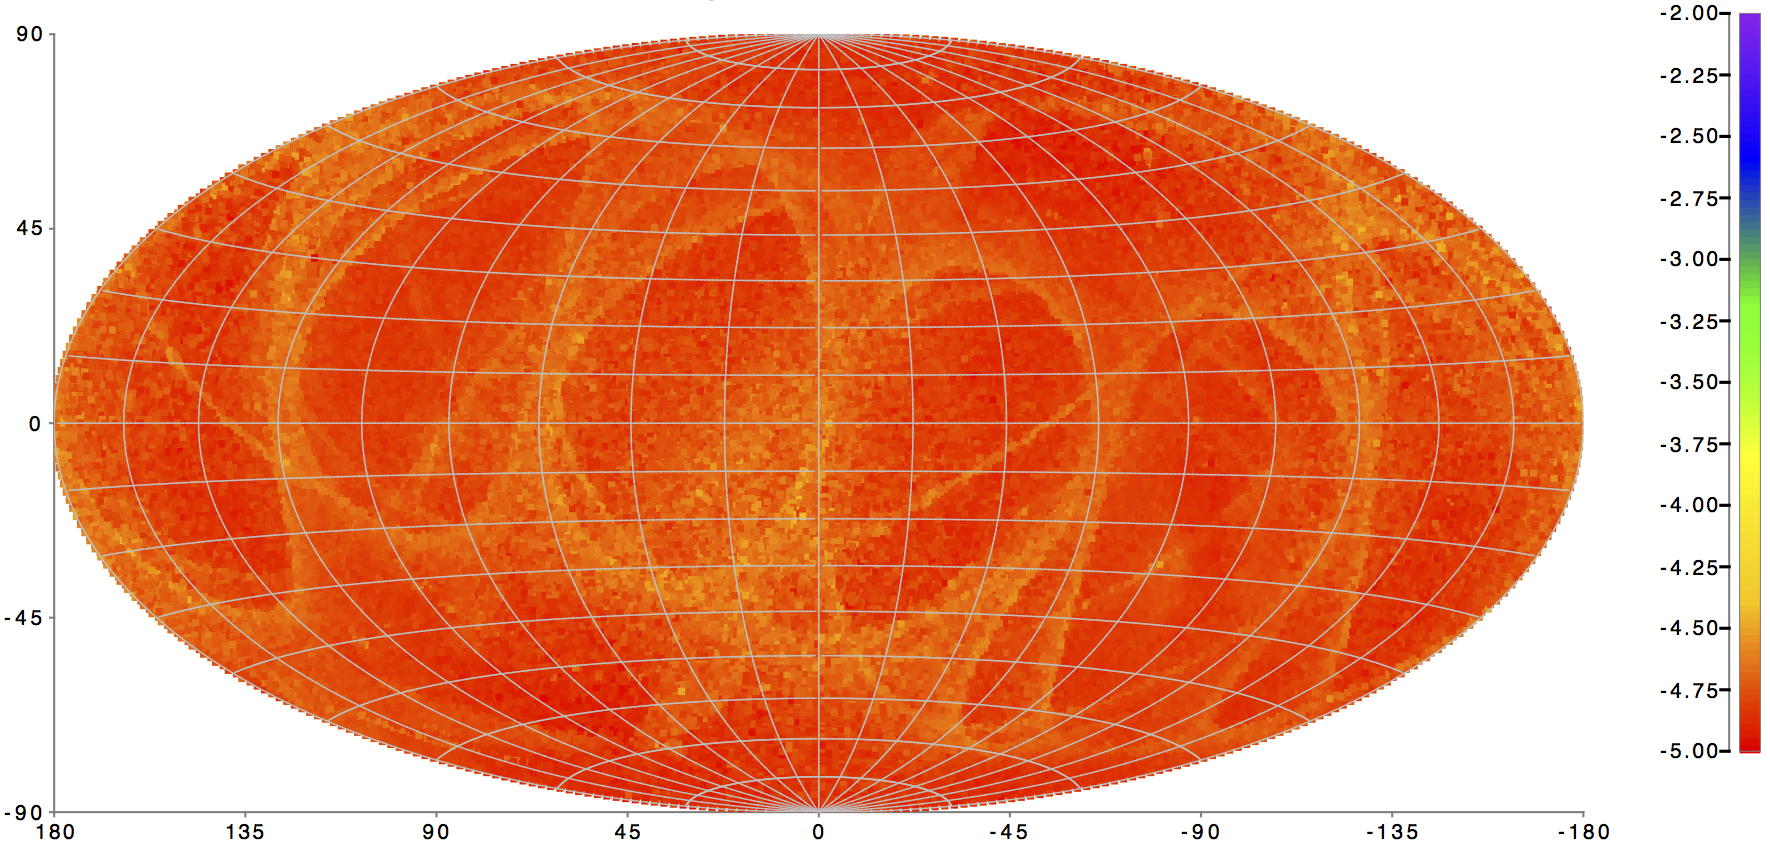
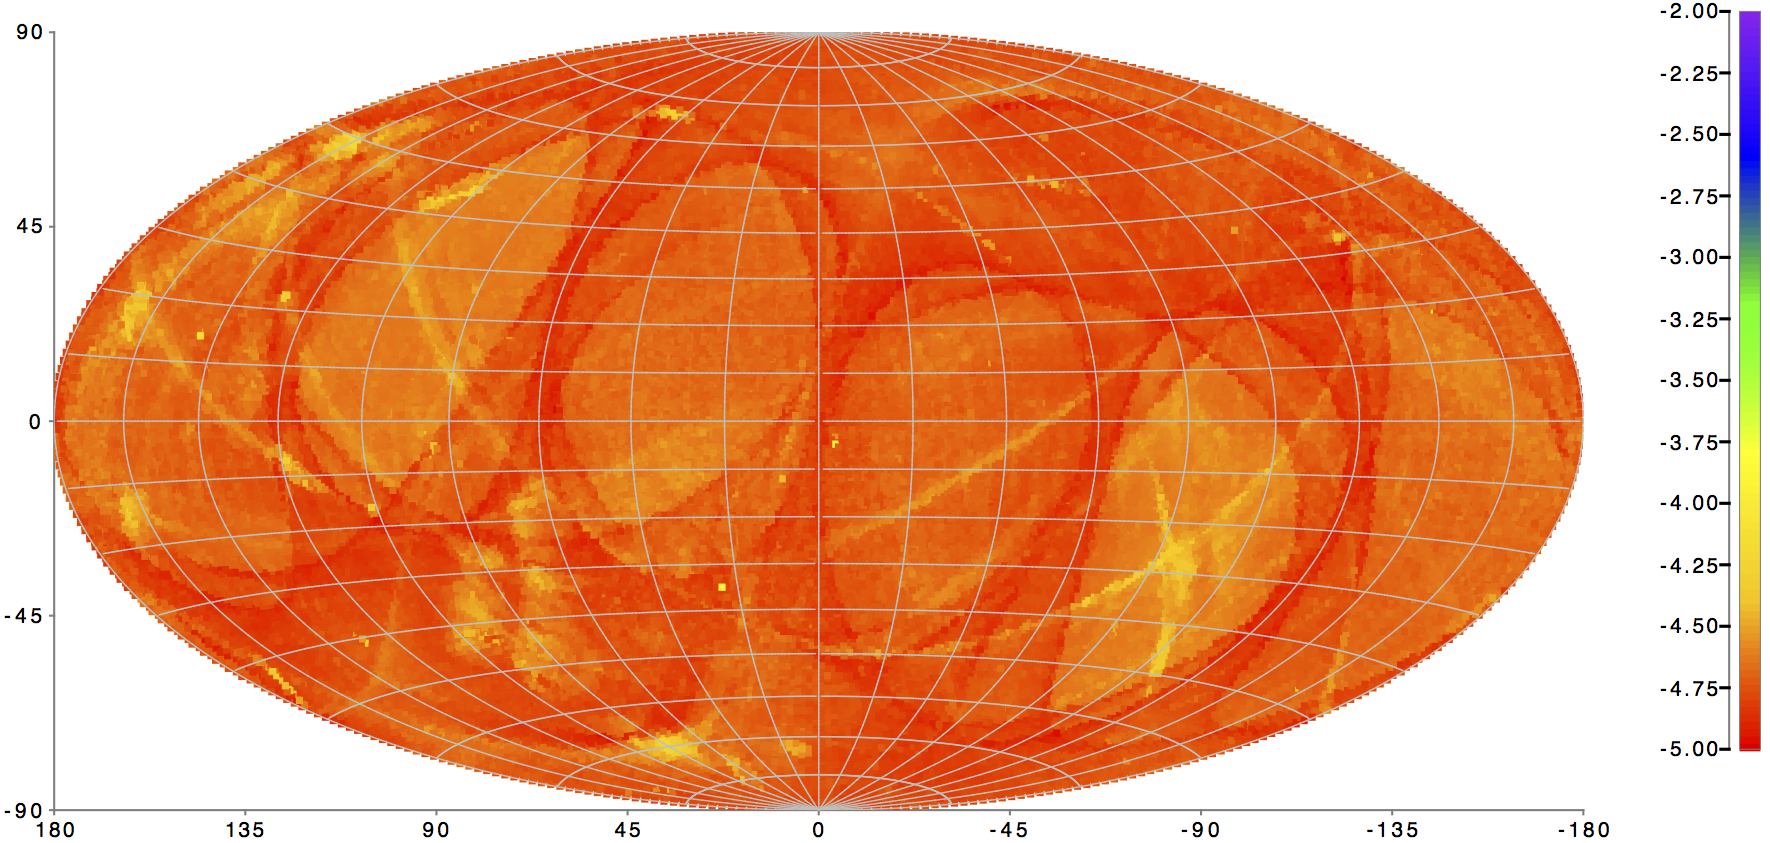
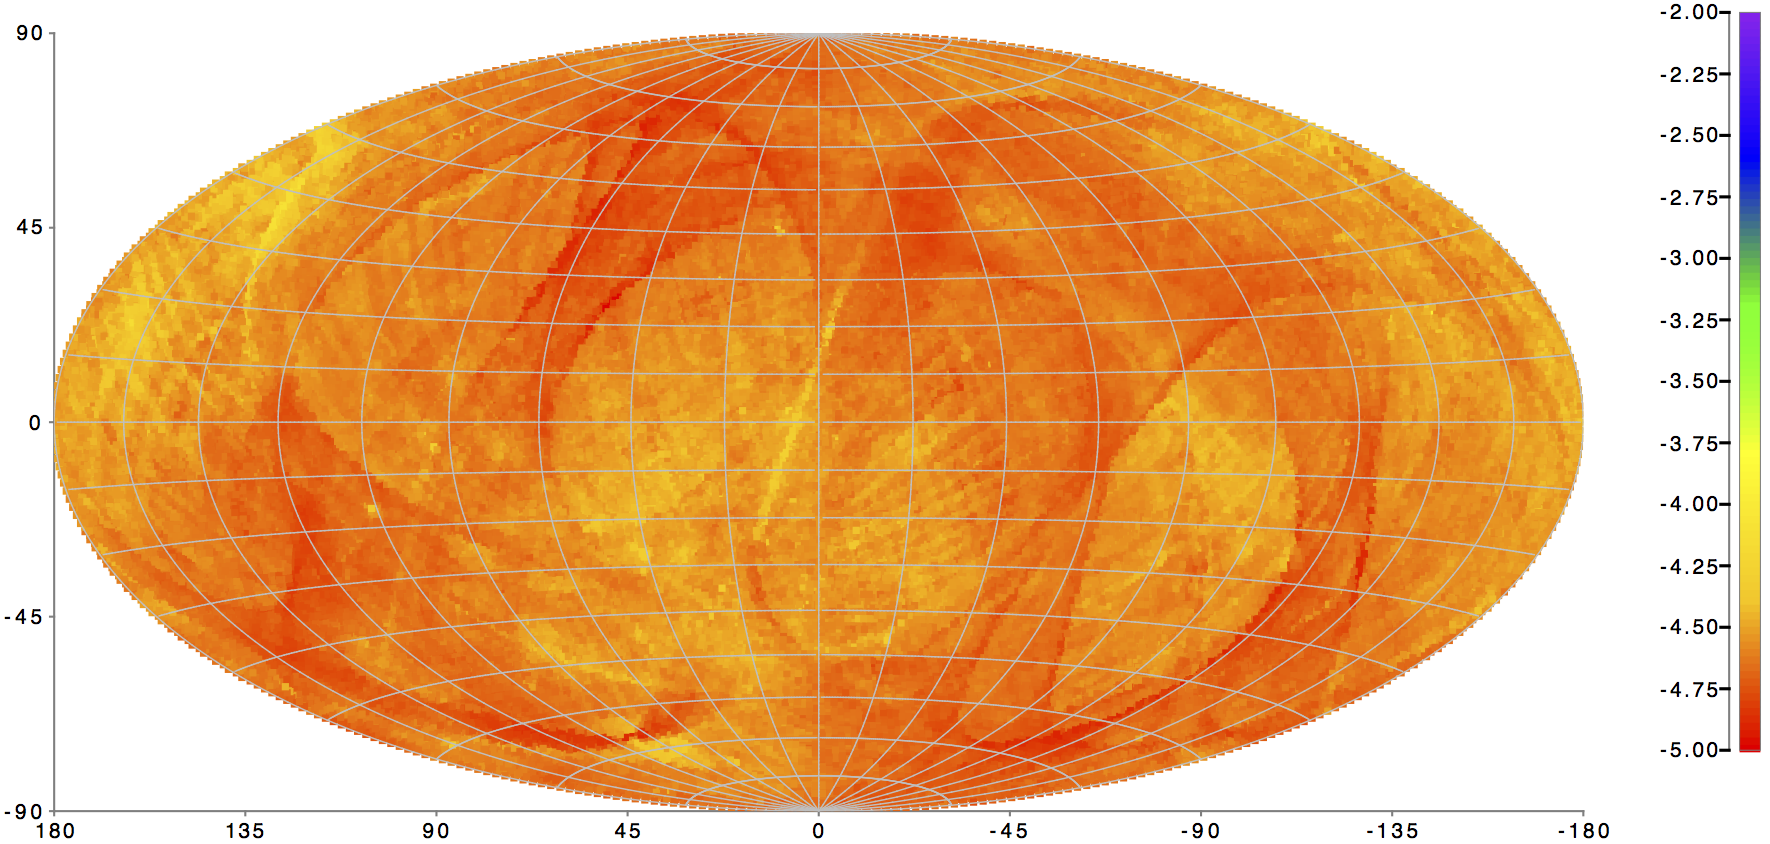
Fig. 6
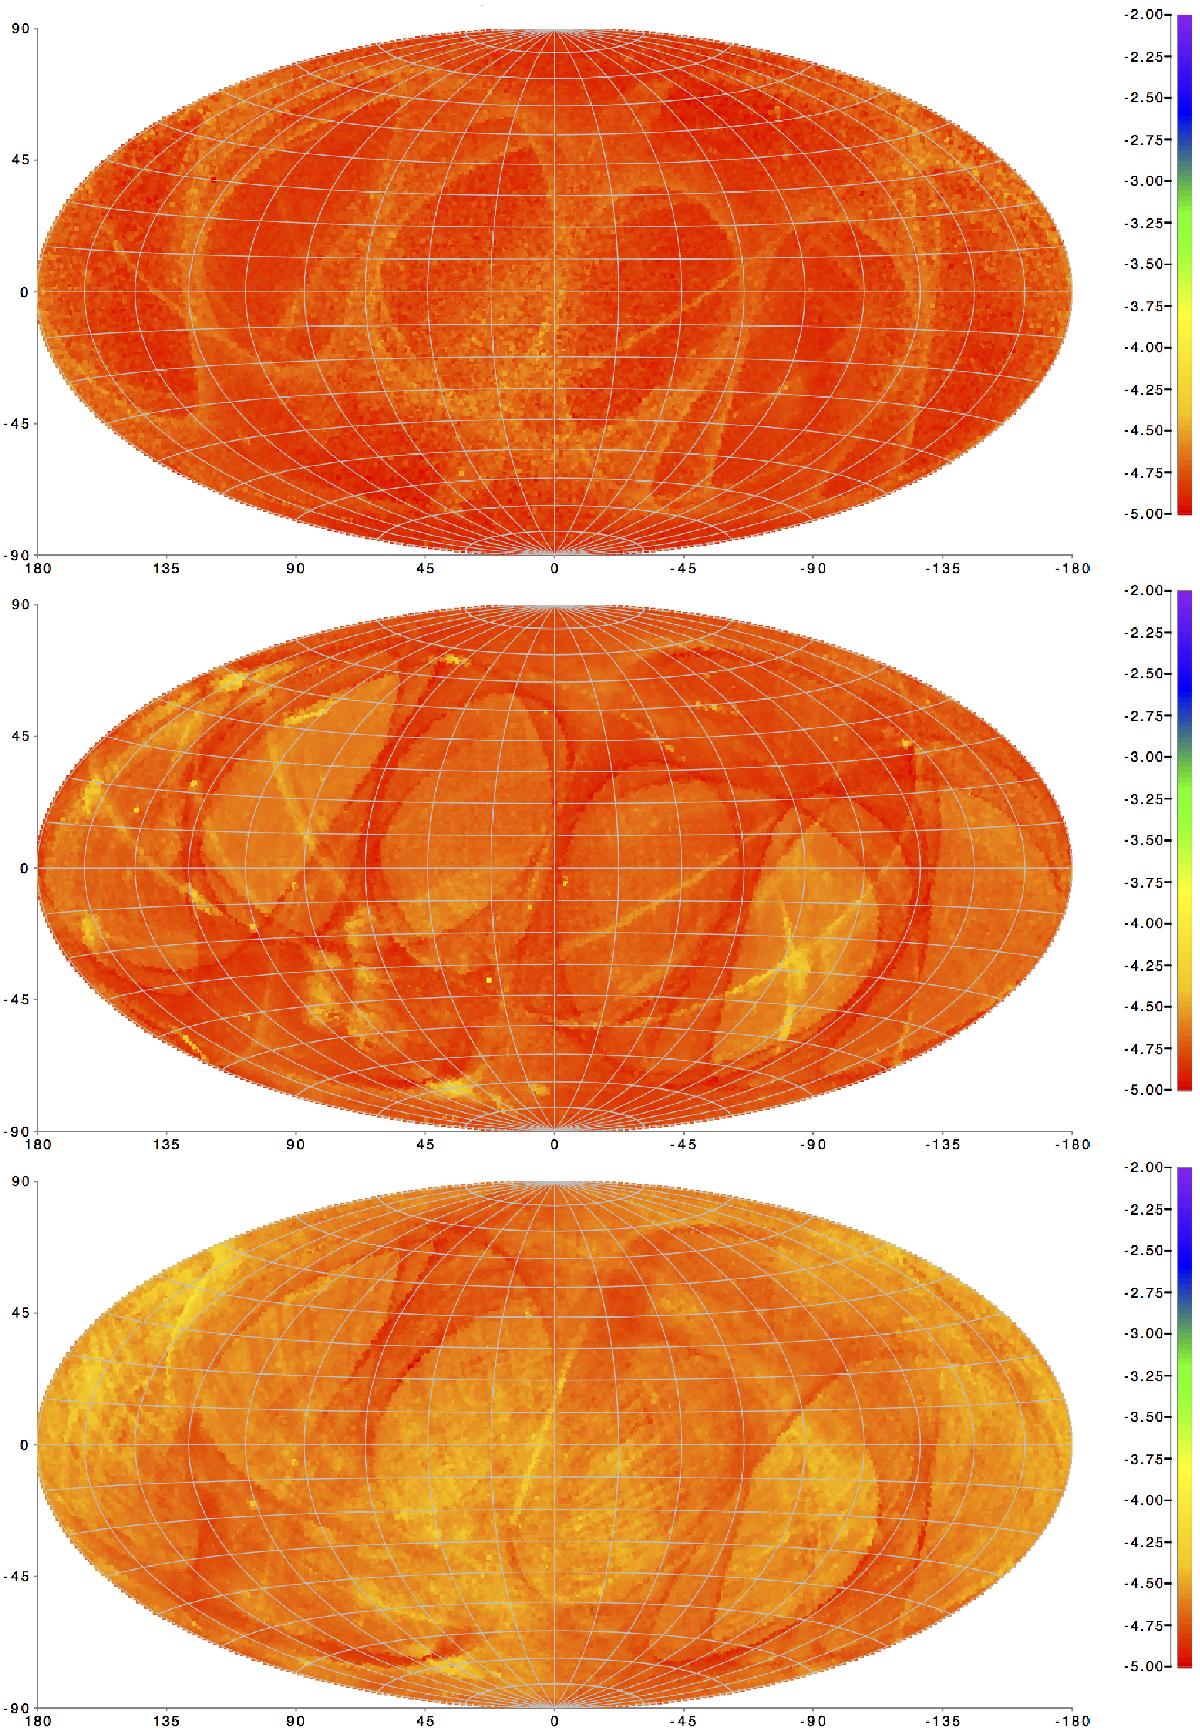
Sky distribution of the estimated errors on the mean G photometry for the different window classes. From top to bottom: Window Class 0 (2D windows), Window Class 1 (1D windows), Window Class 2 (smaller 1D windows). The window class is allocated depending on the magnitude of the observed star as determined onboard during detection.
Current usage metrics show cumulative count of Article Views (full-text article views including HTML views, PDF and ePub downloads, according to the available data) and Abstracts Views on Vision4Press platform.
Data correspond to usage on the plateform after 2015. The current usage metrics is available 48-96 hours after online publication and is updated daily on week days.
Initial download of the metrics may take a while.