Fig. 5
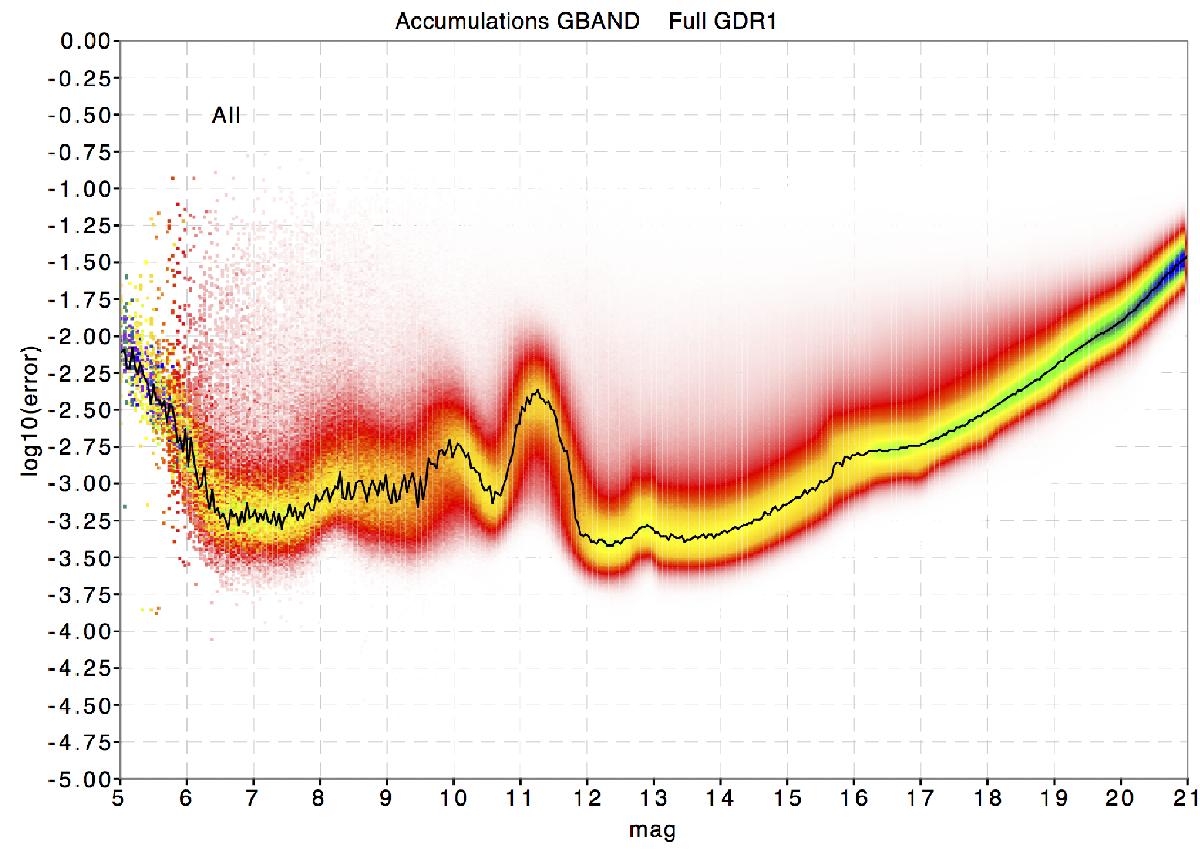
Chart showing the estimated uncertainties on the weighted mean G-band values as a function of magnitude. The colours represent the density of sources, from red (low) to blue (high). The distribution of sources has been flattened for this plot to make sure that features at all magnitudes were visible. For stars between magnitudes 12 and 16 the relation between estimated error and magnitude is close to what could be expected based on noise models. For fainter stars the effect of the background can be noted, while for brighter stars the estimated errors are larger than expected due to effects related to different gate settings and saturation. For a comparison with the expected errors see Evans et al. (2017).
Current usage metrics show cumulative count of Article Views (full-text article views including HTML views, PDF and ePub downloads, according to the available data) and Abstracts Views on Vision4Press platform.
Data correspond to usage on the plateform after 2015. The current usage metrics is available 48-96 hours after online publication and is updated daily on week days.
Initial download of the metrics may take a while.