Fig. 2
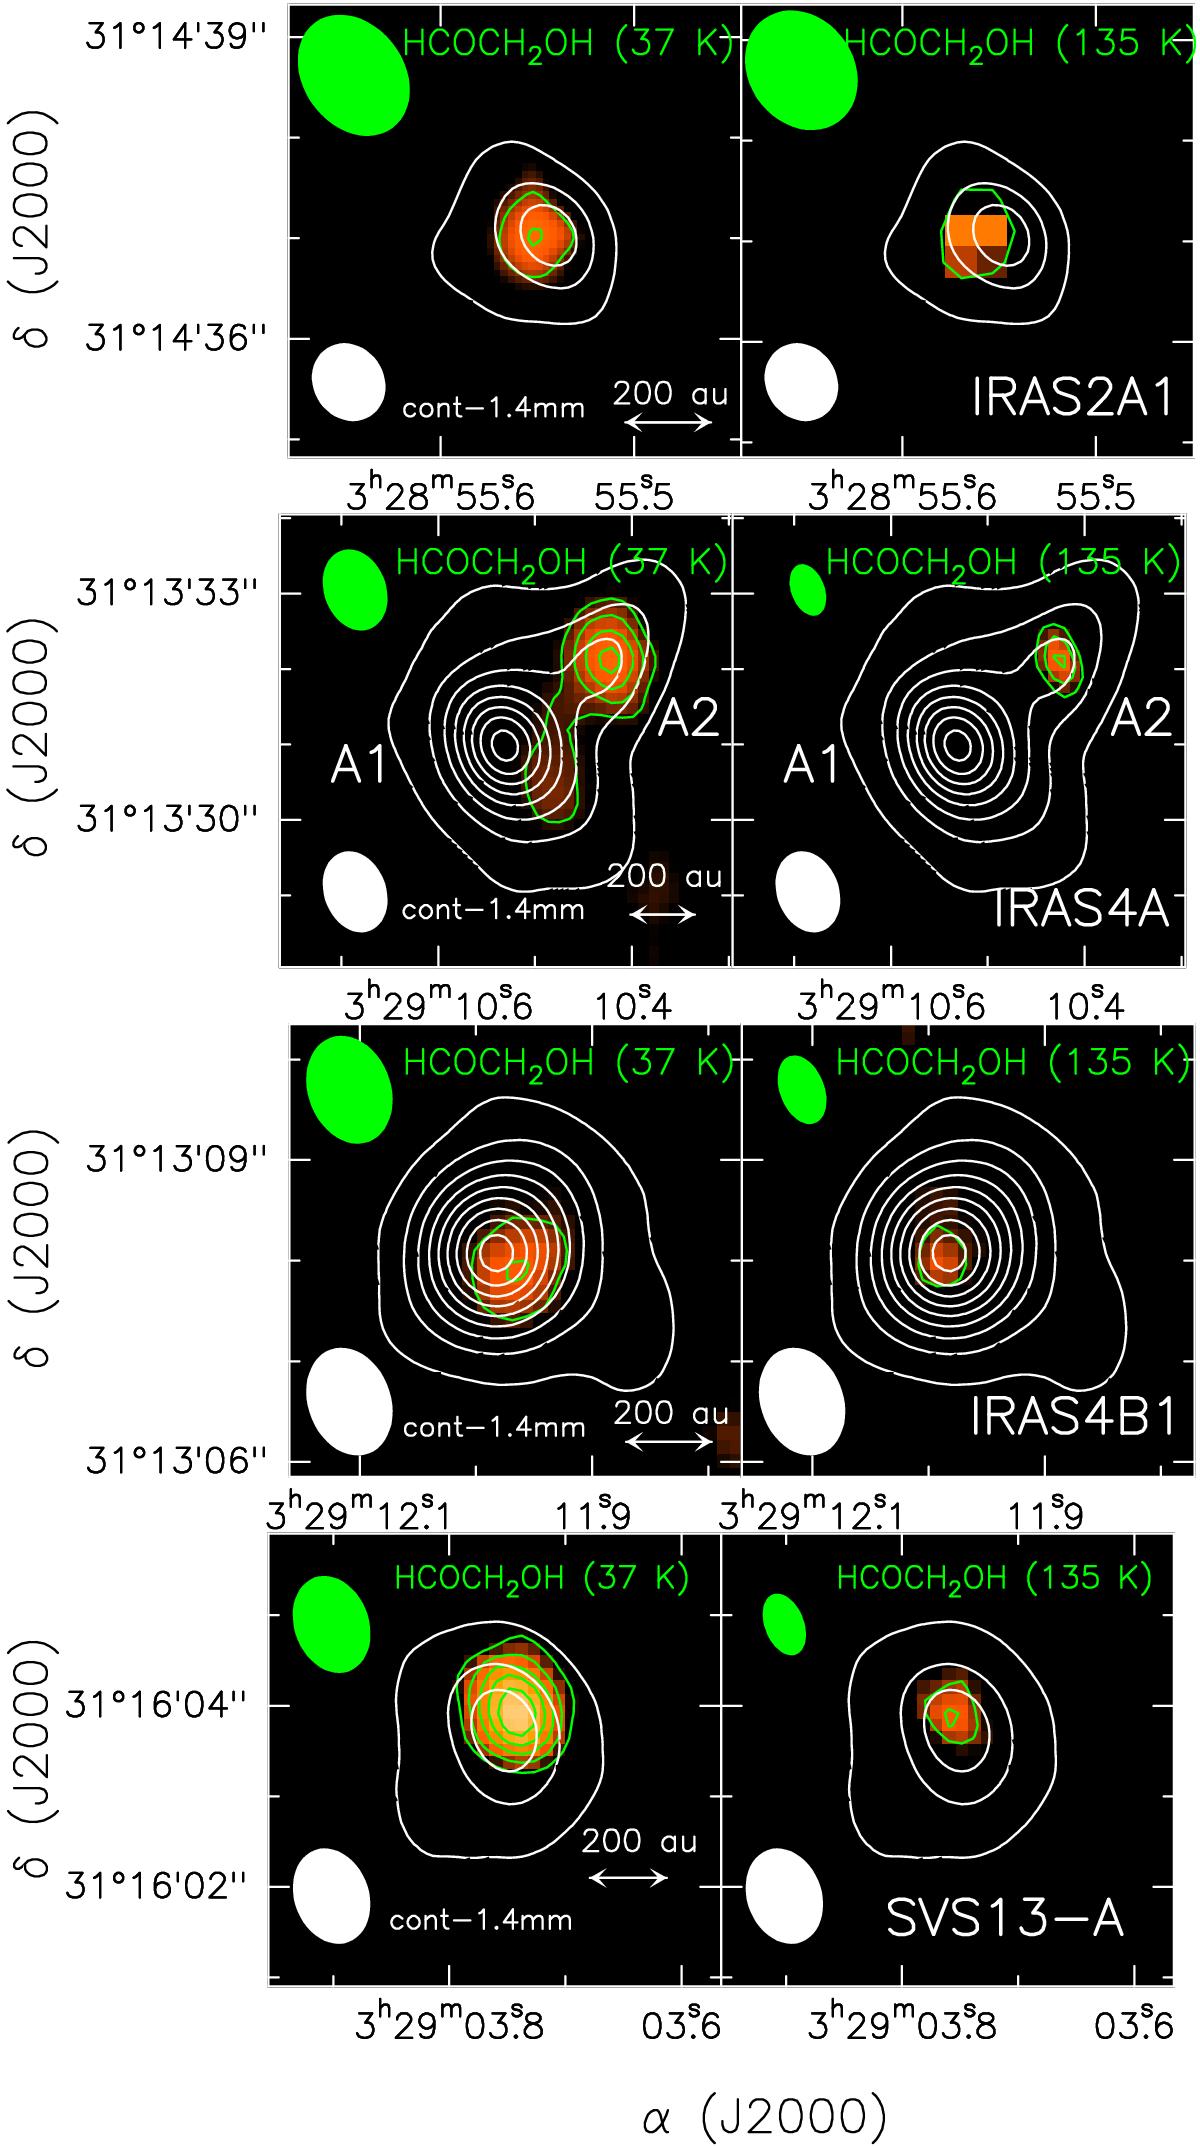
Comparison between the 1.4 mm continuum (white contours) and the glycolaldehyde spatial distributions (colour scale and green contours) towards (from top to bottom) NGC 1333-IRAS2A1, NGC 1333-IRAS4A, NGC 1333-IRAS4B1, and NGC 1333 SVS13-A. For continuum, first contours and steps correspond to 5σ (14 mJy beam-1) and 10σ, respectively. The ellipses show the PdBI synthesised beam (HPBW) for the continuum (white, see Table 1) and glycolaldehyde images. The HPBWs for the glycolaldehyde images at 1.4 mm are: 0![]() 82 × 0
82 × 0![]() 70, 32° (NGC 1333-IRAS2A1), 1
70, 32° (NGC 1333-IRAS2A1), 1![]() 08 × 0
08 × 0![]() 81, 19° (NGC 1333-IRAS4A), 1
81, 19° (NGC 1333-IRAS4A), 1![]() 08 × 0
08 × 0![]() 83, 20° (NGC 1333-IRAS4B1), and 1
83, 20° (NGC 1333-IRAS4B1), and 1![]() 06 × 0
06 × 0![]() 80, 20° (NGC 1333 SVS13-A). The HPBWs for the glycolaldehyde images at 1.3 mm are: 0
80, 20° (NGC 1333 SVS13-A). The HPBWs for the glycolaldehyde images at 1.3 mm are: 0![]() 82 × 0
82 × 0![]() 70, 32° (NGC 1333-IRAS2A1), 0
70, 32° (NGC 1333-IRAS2A1), 0![]() 72 × 0
72 × 0![]() 44, 21° (NGC 1333-IRAS4A), 0
44, 21° (NGC 1333-IRAS4A), 0![]() 72 × 0
72 × 0![]() 44, 21° (NGC 1333-IRAS4B1), and 0
44, 21° (NGC 1333-IRAS4B1), and 0![]() 71 × 0
71 × 0![]() 43, 21° (NGC 1333 SVS13-A). Left panels: glycolaldehyde distribution refers to the sum of the 76,2–65,1 and 76,1–65,2 emission with (220.2 GHz, Eu = 37 K; see Tables A.1–A.4). First contours and steps correspond to 5σ (90, 90, 75, and 55 mJy beam-1 km s-1 respectively for NGC 1333-IRAS2A1, NGC 1333-IRAS4A, NGC 1333-IRAS4B1, and NGC 1333 SVS13-A) and 3σ, respectively. Right panels: glycolaldehyde distribution refers to the 222,21–211,20 emission (232.3 GHz, Eu = 135 K; see Tables 2–5). First contours and steps correspond to 5σ (100, 110, 50, and 60 mJy beam-1 km s-1 respectively for NGC 1333-IRAS2A1, NGC 1333–IRAS4A, NGC 1333-IRAS4B1, and NGC 1333 SVS13-A) and 3σ, respectively.
43, 21° (NGC 1333 SVS13-A). Left panels: glycolaldehyde distribution refers to the sum of the 76,2–65,1 and 76,1–65,2 emission with (220.2 GHz, Eu = 37 K; see Tables A.1–A.4). First contours and steps correspond to 5σ (90, 90, 75, and 55 mJy beam-1 km s-1 respectively for NGC 1333-IRAS2A1, NGC 1333-IRAS4A, NGC 1333-IRAS4B1, and NGC 1333 SVS13-A) and 3σ, respectively. Right panels: glycolaldehyde distribution refers to the 222,21–211,20 emission (232.3 GHz, Eu = 135 K; see Tables 2–5). First contours and steps correspond to 5σ (100, 110, 50, and 60 mJy beam-1 km s-1 respectively for NGC 1333-IRAS2A1, NGC 1333–IRAS4A, NGC 1333-IRAS4B1, and NGC 1333 SVS13-A) and 3σ, respectively.
Current usage metrics show cumulative count of Article Views (full-text article views including HTML views, PDF and ePub downloads, according to the available data) and Abstracts Views on Vision4Press platform.
Data correspond to usage on the plateform after 2015. The current usage metrics is available 48-96 hours after online publication and is updated daily on week days.
Initial download of the metrics may take a while.