Free Access
Fig. 6
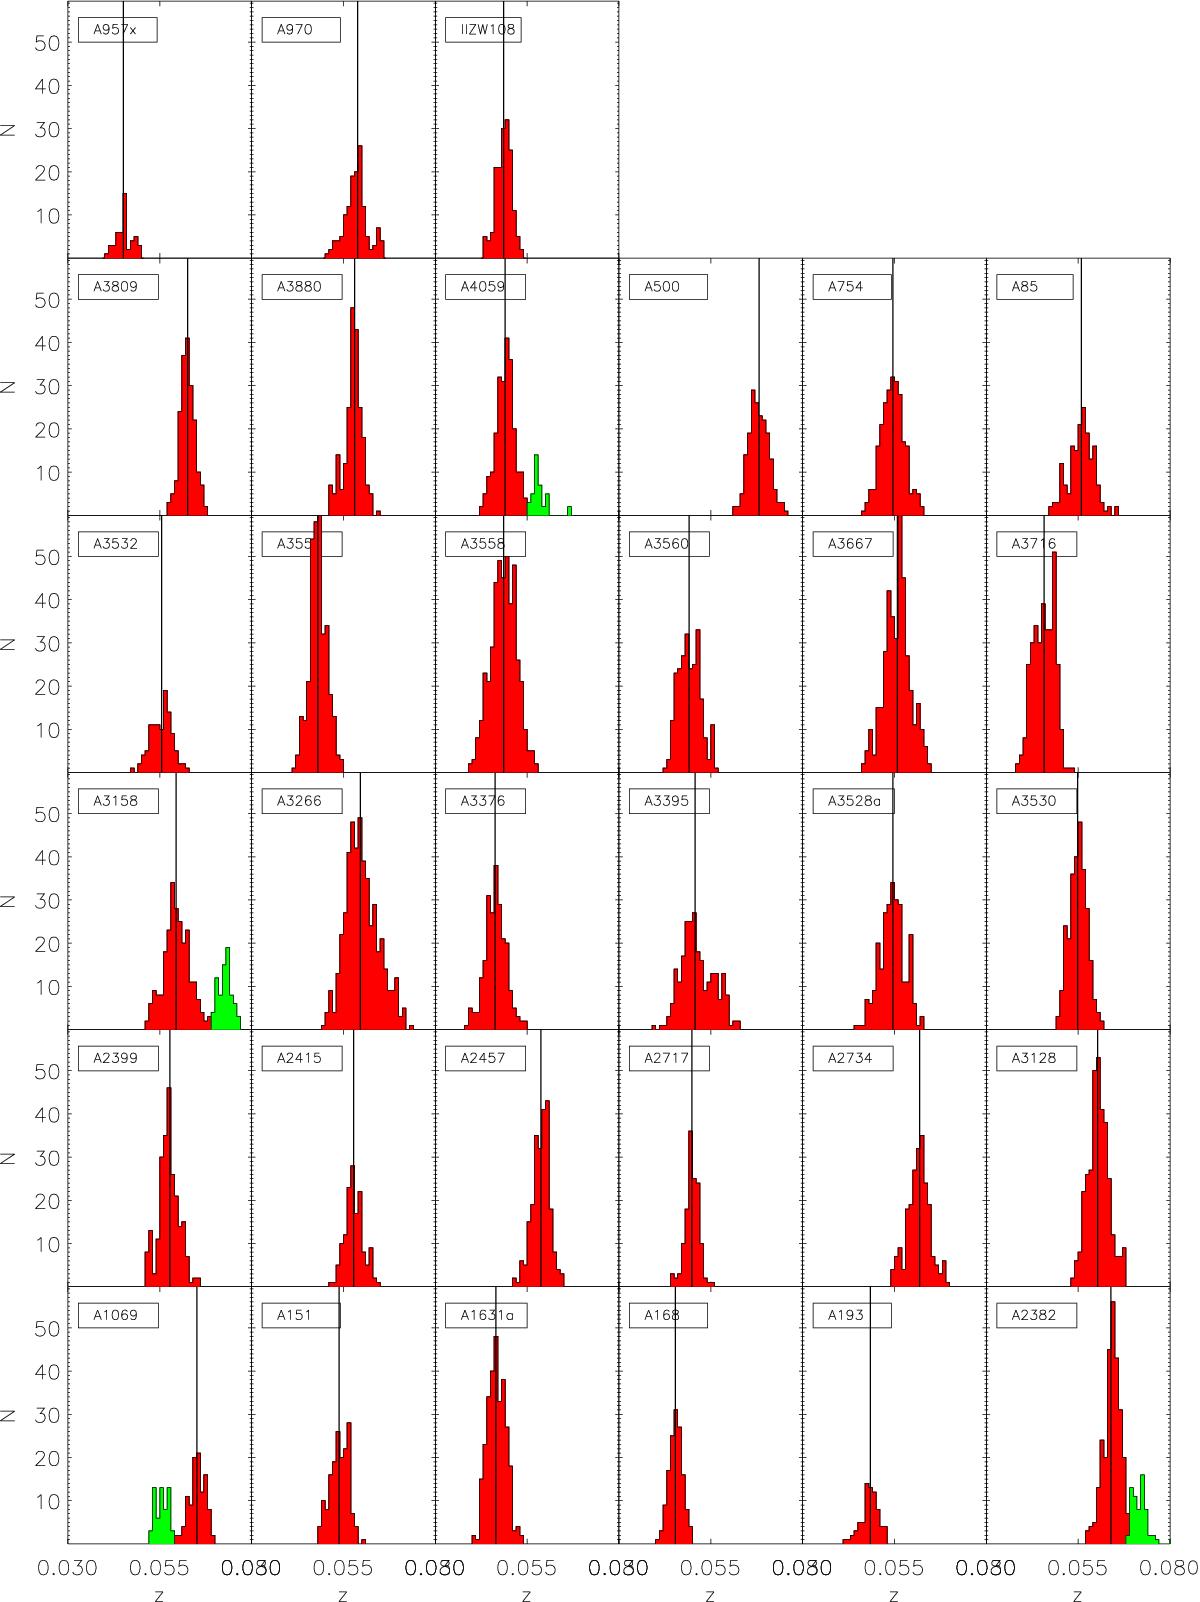
Redshift distribution of the observed clusters as derived from the OmegaWINGS observations only. The vertical line shows the median cluster redshift (see Sect. 6 for the details). Green histograms refer to other probable structures close in velocity.
Current usage metrics show cumulative count of Article Views (full-text article views including HTML views, PDF and ePub downloads, according to the available data) and Abstracts Views on Vision4Press platform.
Data correspond to usage on the plateform after 2015. The current usage metrics is available 48-96 hours after online publication and is updated daily on week days.
Initial download of the metrics may take a while.