Fig. 4
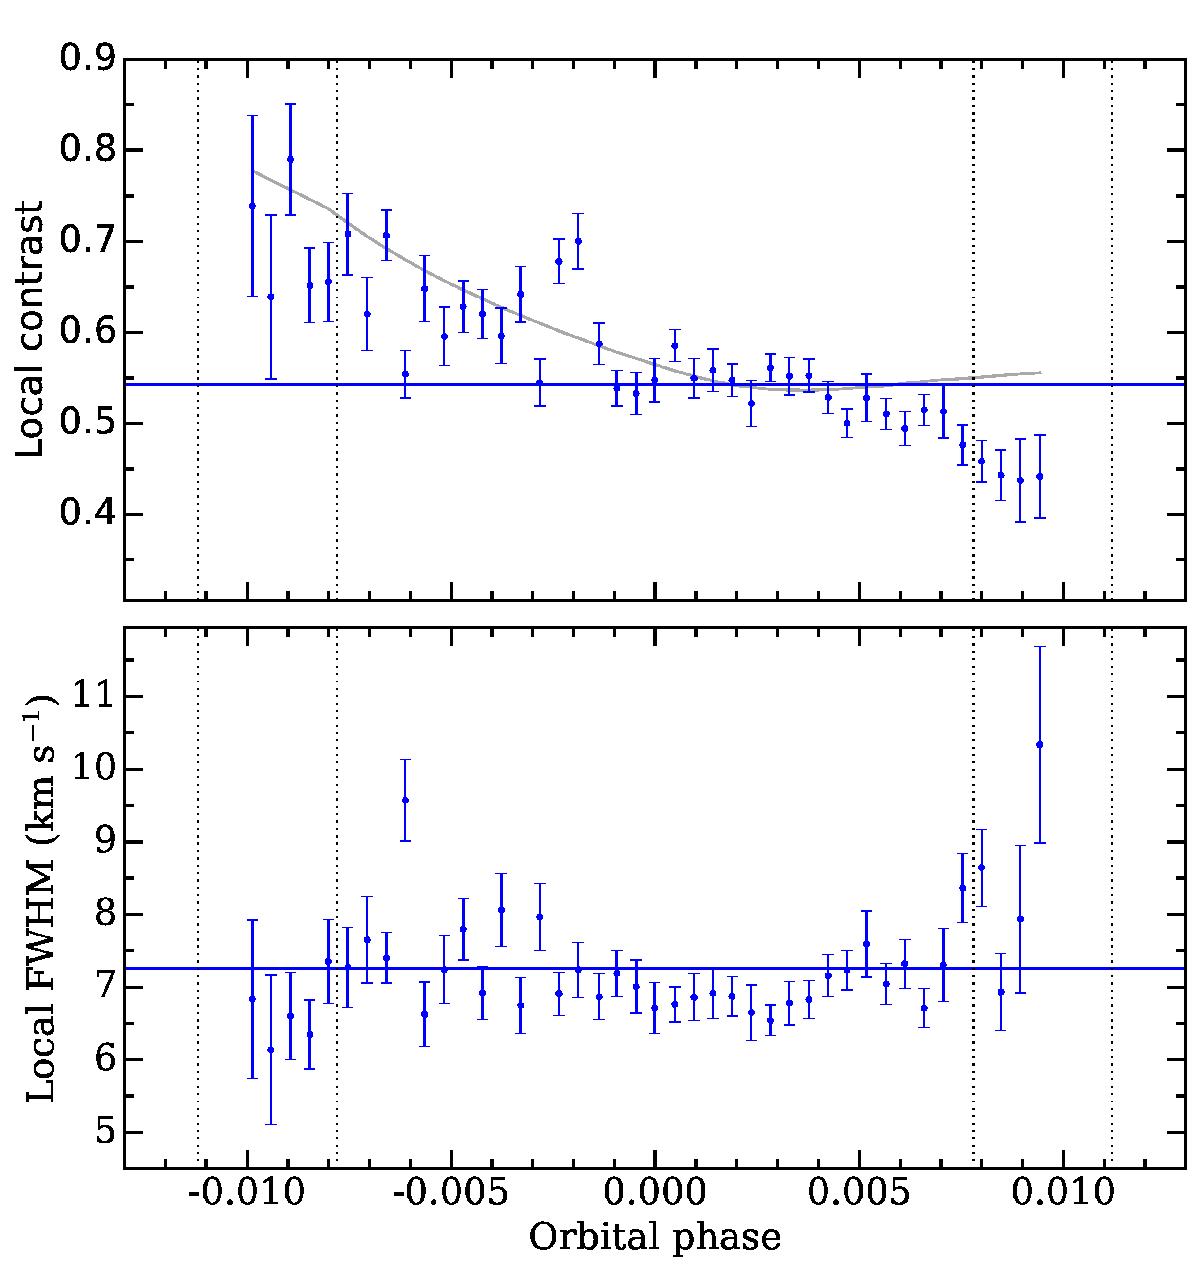
Contrast (upper panel) and FWHM (lower panel) of the local CCFloc from the planet-occulted regions as a function of orbital phase. A significant decrease in contrast occurs along the transit chord, while the FHWM remains stable overall. The solid horizontal lines correspond to the contrast and FWHM of the disk-integrated CCFDI measured outside of the planet transit. Vertical dotted lines indicate the planet contacts. The gray line in the upper panel shows our best fit for the local contrast, assuming it varies linearly from the pole to the equator of the star.
Current usage metrics show cumulative count of Article Views (full-text article views including HTML views, PDF and ePub downloads, according to the available data) and Abstracts Views on Vision4Press platform.
Data correspond to usage on the plateform after 2015. The current usage metrics is available 48-96 hours after online publication and is updated daily on week days.
Initial download of the metrics may take a while.