Fig. 3
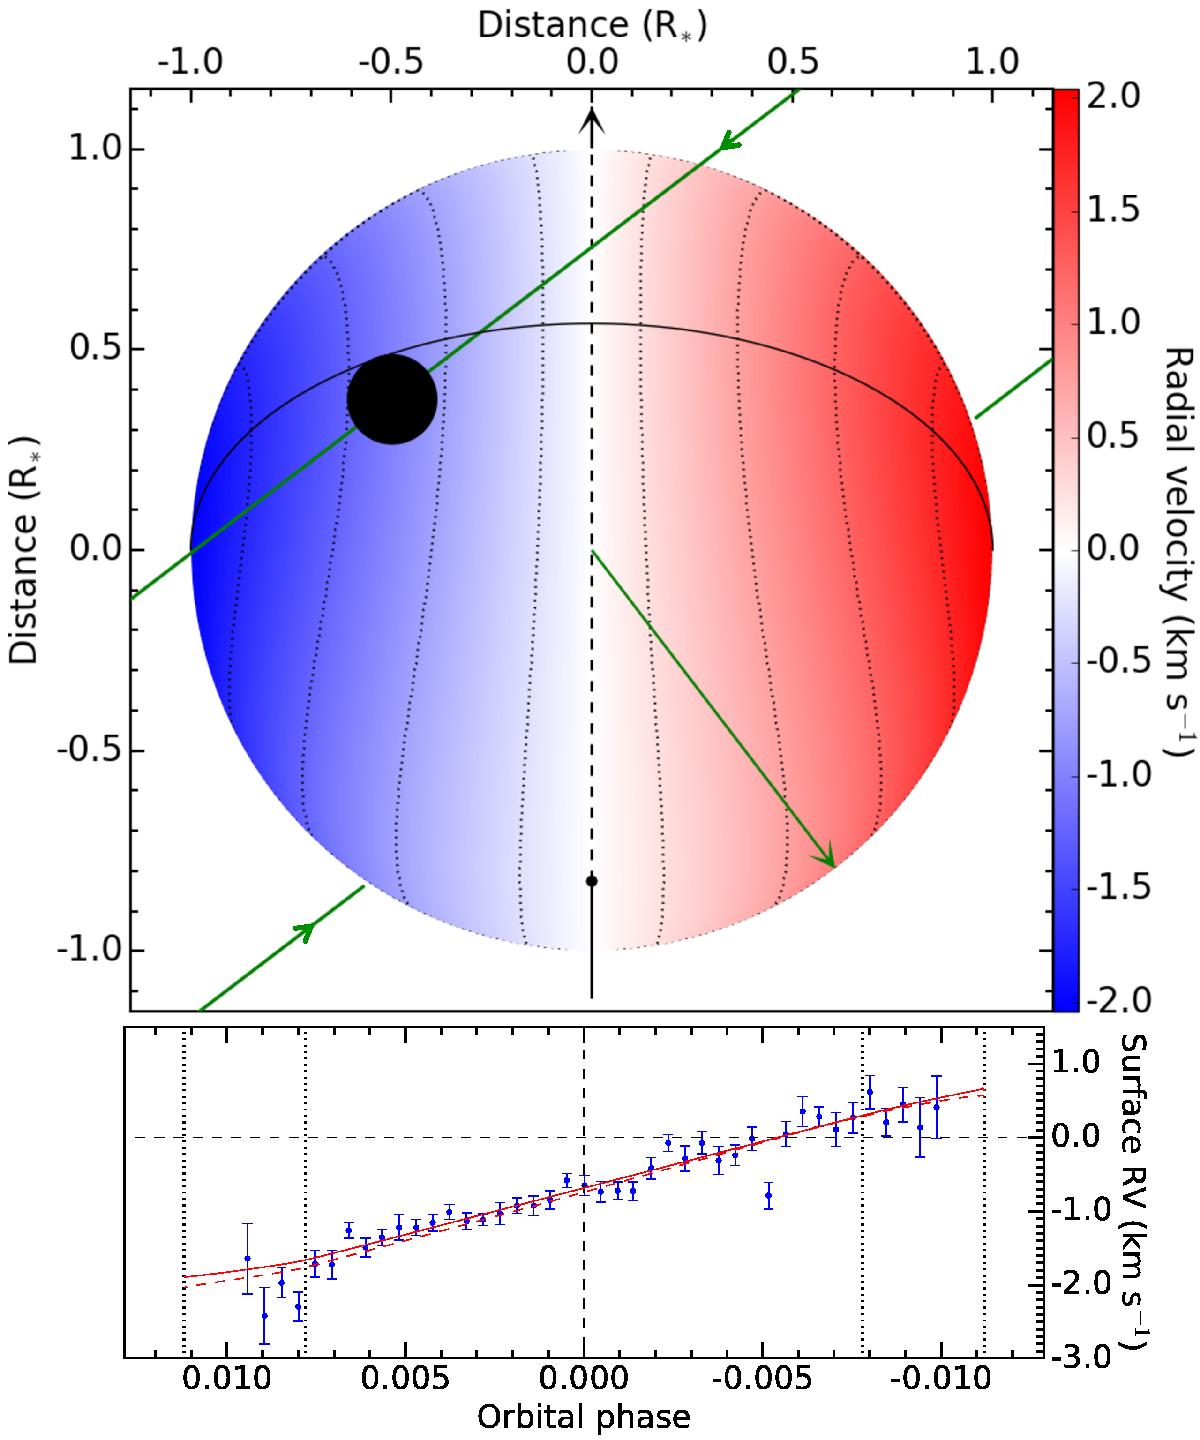
Upper panel: projection of WASP-8 in the plane of sky for the best fit in the differential-rotation scenario. The stellar disk is colored as a function of its RV field with thin black lines showing iso-RV curves equally spaced. The stellar spin axis is inclined and shown as a black arrow going from the south pole to the north pole (dashed when within the star). The normal to the orbital plane is shown as a green arrow, and the orbital trajectory is shown as a green curve. In the solid-body scenario, the spin axis orientation is degenerate and iso-RV curves would be parallel to the projected stellar spin. Lower panel: surface RVs of the regions occulted by the planet, as a function of orbital phase (increasing from right to left to match the retrograde motion of the planet). The measurements (blue points) are well reproduced in both the SB (solid red curve) and DR (dashed red curve) scenarios
Current usage metrics show cumulative count of Article Views (full-text article views including HTML views, PDF and ePub downloads, according to the available data) and Abstracts Views on Vision4Press platform.
Data correspond to usage on the plateform after 2015. The current usage metrics is available 48-96 hours after online publication and is updated daily on week days.
Initial download of the metrics may take a while.