Fig. 2
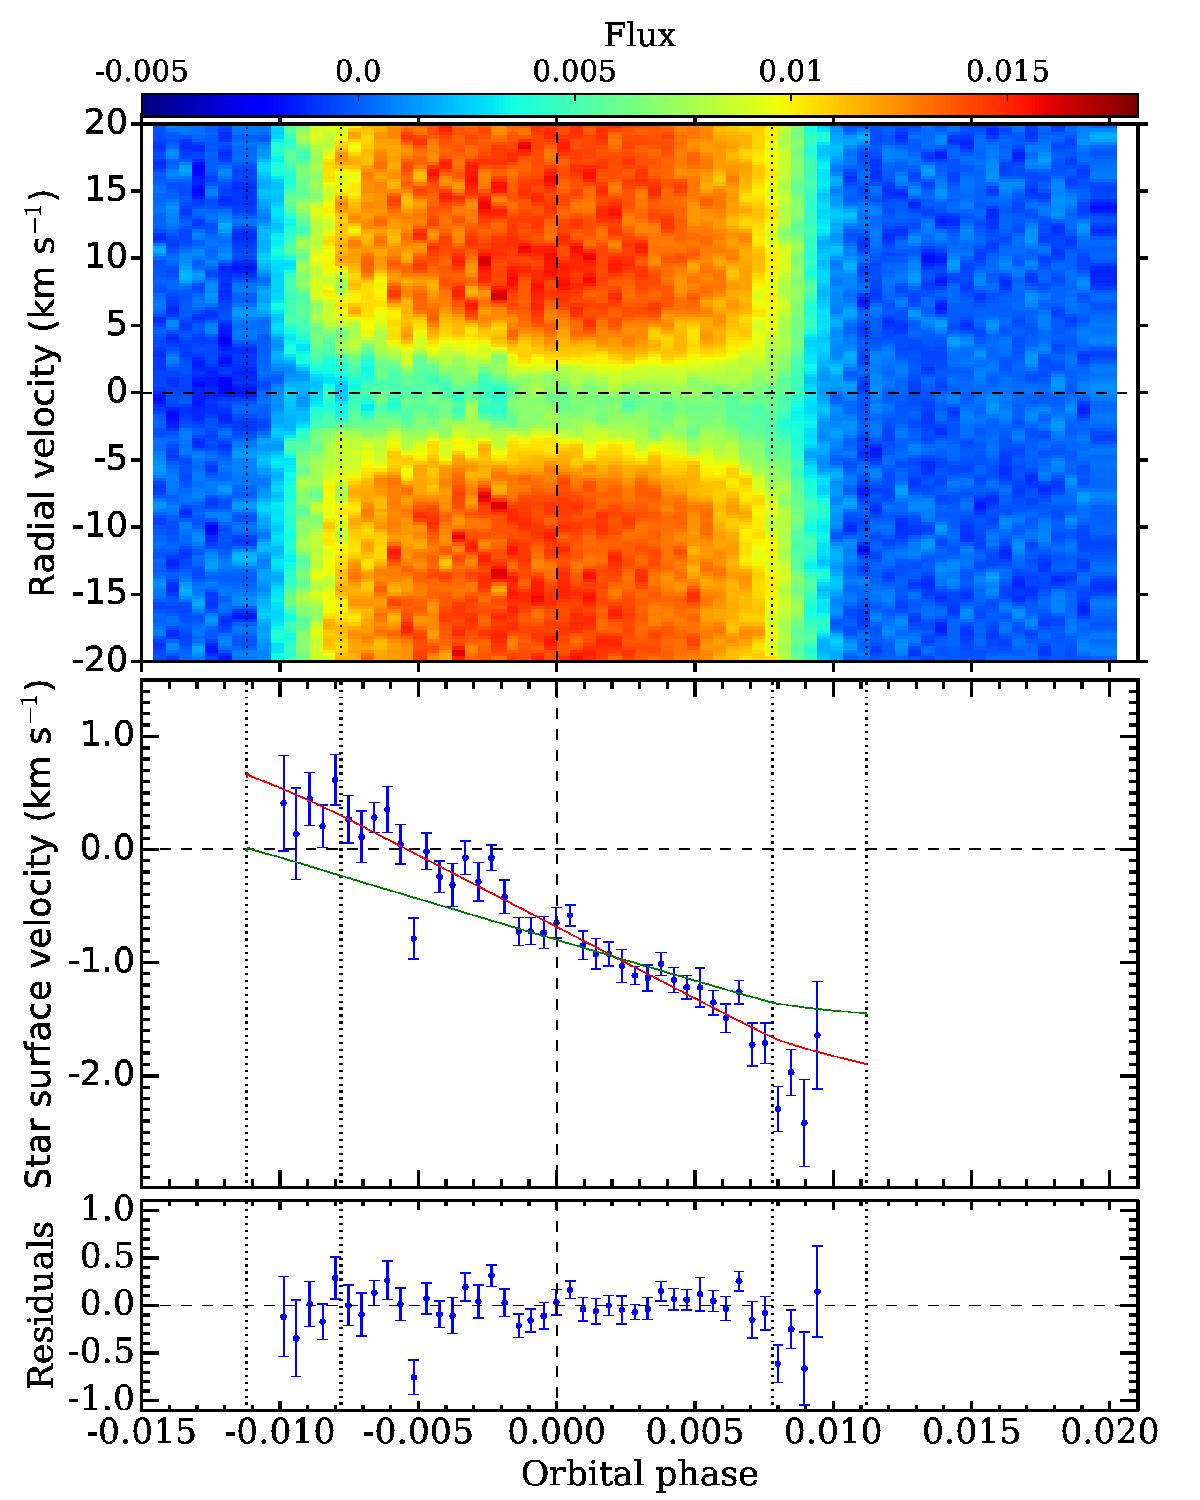
Upper panel: map of the CCFloc series, as a function of orbital phase (in abscissa) and radial velocity in the stellar rest frame (in ordinate). Colors indicate flux values. The vertical and horizontal dashed black lines indicate the mid-transit time and stellar rest velocity, respectively. The four vertical dotted black lines show the times of the contacts. The in-transit CCFloc correspond to the average stellar line profiles from the regions occulted by WASP-8b across the stellar disk. Middle panel: RVs of the stellar surface regions occulted by the planet (blue points). The green curve is the RV model obtained for the obliquity and rotational velocity in Queloz et al. (2010). The red curve corresponds to our best fit for the solid-body rotation case. Lower panel: residuals between the measured surface RV and our best-fit shown in the middle panel.
Current usage metrics show cumulative count of Article Views (full-text article views including HTML views, PDF and ePub downloads, according to the available data) and Abstracts Views on Vision4Press platform.
Data correspond to usage on the plateform after 2015. The current usage metrics is available 48-96 hours after online publication and is updated daily on week days.
Initial download of the metrics may take a while.