Fig. 8
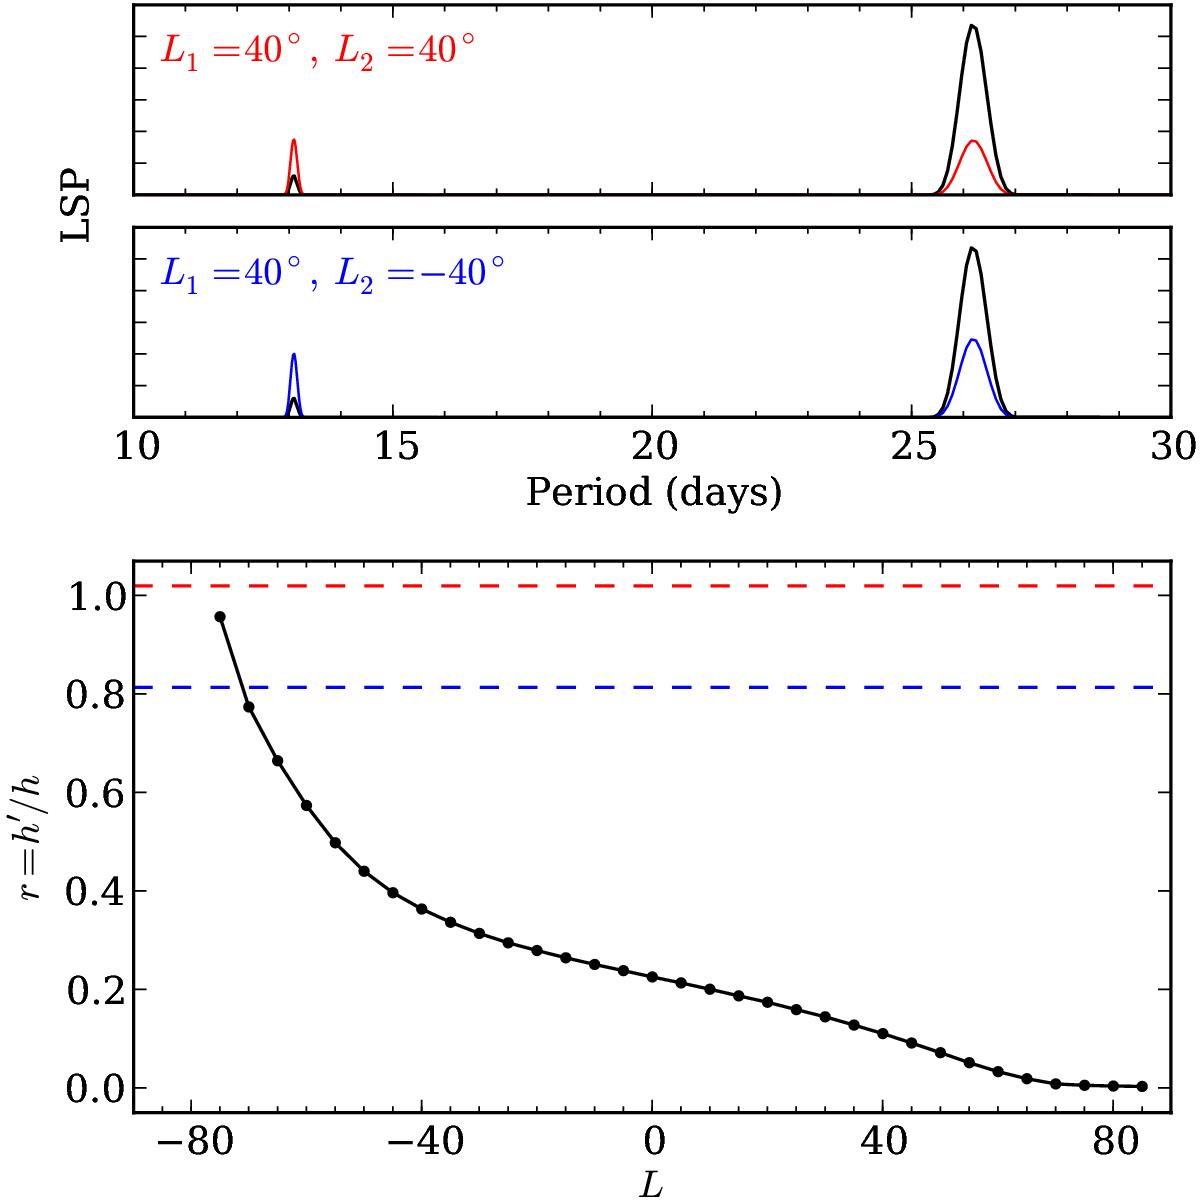
Top and middle panels: Lomb-Scargle periodogram of two synthetic light curves whose modulation is produced by two spots rotating with equal velocity and in anti-phase. In the first example (red) both spots are on the northern hemisphere, while in the second panel (blue) the spots are on opposite hemispheres. The black line corresponds to the reference case of one spot at L1 = 40°. Bottom: comparison between the peak-height ratios recovered from the top and middle panels (red and blue, respectively) and the reference ratios for i = 70° (black).
Current usage metrics show cumulative count of Article Views (full-text article views including HTML views, PDF and ePub downloads, according to the available data) and Abstracts Views on Vision4Press platform.
Data correspond to usage on the plateform after 2015. The current usage metrics is available 48-96 hours after online publication and is updated daily on week days.
Initial download of the metrics may take a while.