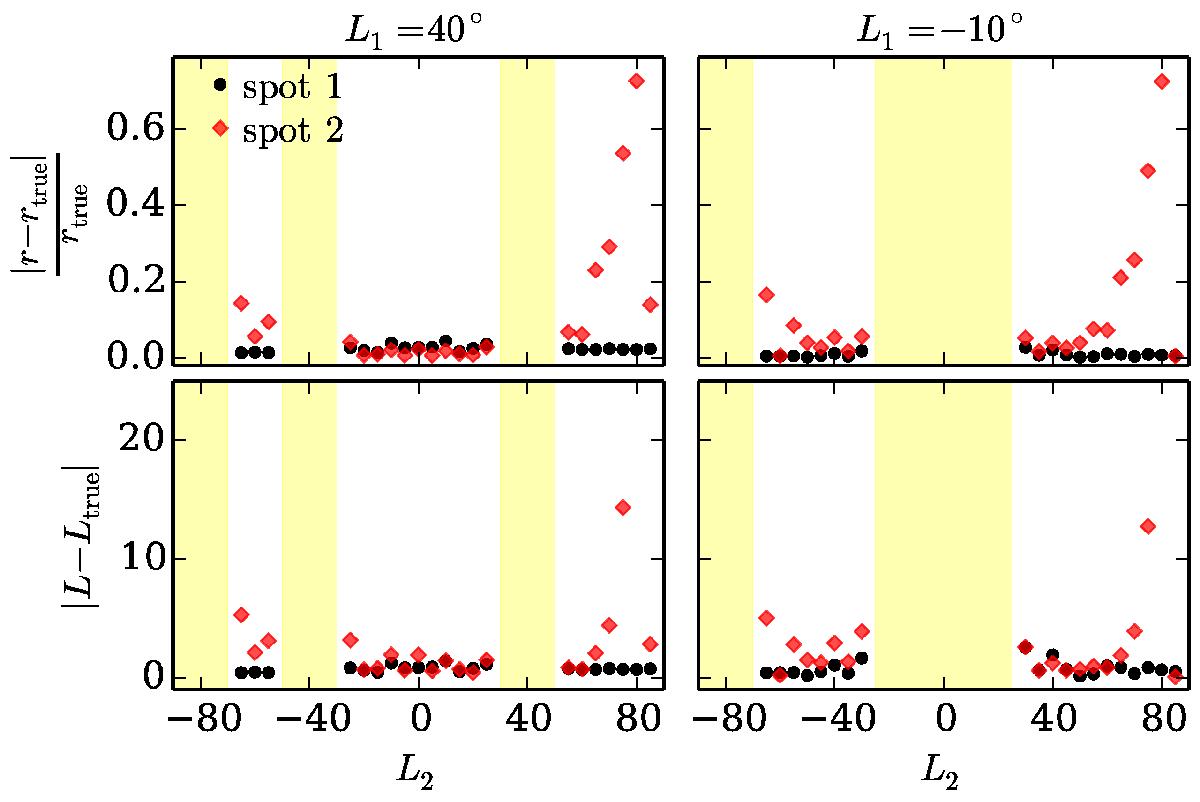
Fig. 6

Error on the peak-height ratios (top) and latitudes (bottom) as a function of the latitude of the second spot. Black and red symbols concern spots 1 and 2, respectively. The left panels correspond to L1 = 40°, while the right panels show the results for ![]() . The yellow areas mark the latitude intervals where only one rotation period was detected. Here we disregarded the cases in which the peak-height ratios were outside the one-spot peak-height ratio range given in Fig. 2.
. The yellow areas mark the latitude intervals where only one rotation period was detected. Here we disregarded the cases in which the peak-height ratios were outside the one-spot peak-height ratio range given in Fig. 2.
Current usage metrics show cumulative count of Article Views (full-text article views including HTML views, PDF and ePub downloads, according to the available data) and Abstracts Views on Vision4Press platform.
Data correspond to usage on the plateform after 2015. The current usage metrics is available 48-96 hours after online publication and is updated daily on week days.
Initial download of the metrics may take a while.


