Fig. 5
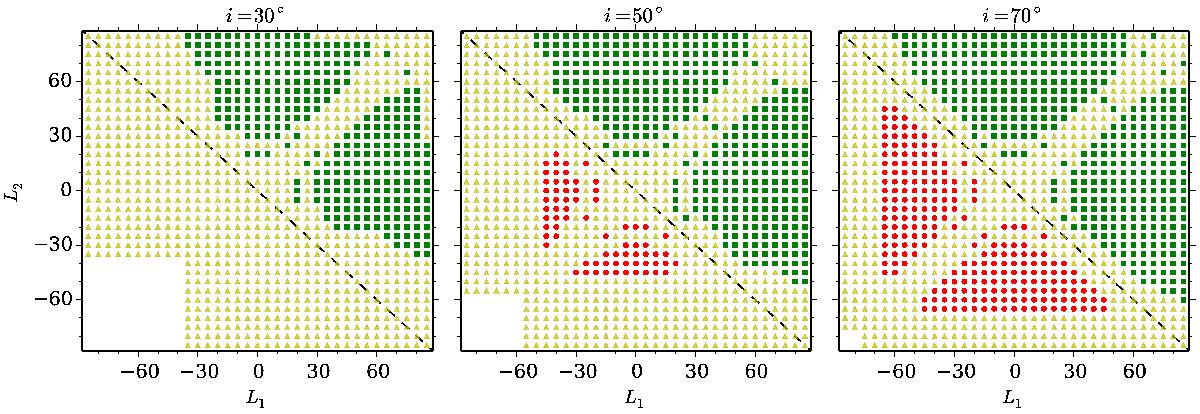
Sign of the surface differential rotation, αobs, for two-spot simulations with stellar inclination angles of i = 30° (left), i = 50° (middle), and i = 70° (right). The spot latitudes (L1 and L2) range from −85° to 85° with steps of 5°. The yellow triangles represent the cases where only one rotation period is detected according to the criteria (see text). The red dots represent the cases where the wrong sign of differential rotation (αobs < 0) is found, while the green squares mark the cases where the correct sign (αobs > 0) is recovered. The dashed line divides the regions where the correct (above) or wrong (below) sign of αobs is expected from the results of Sect. 4.1 (see text for details).
Current usage metrics show cumulative count of Article Views (full-text article views including HTML views, PDF and ePub downloads, according to the available data) and Abstracts Views on Vision4Press platform.
Data correspond to usage on the plateform after 2015. The current usage metrics is available 48-96 hours after online publication and is updated daily on week days.
Initial download of the metrics may take a while.