Fig. 4
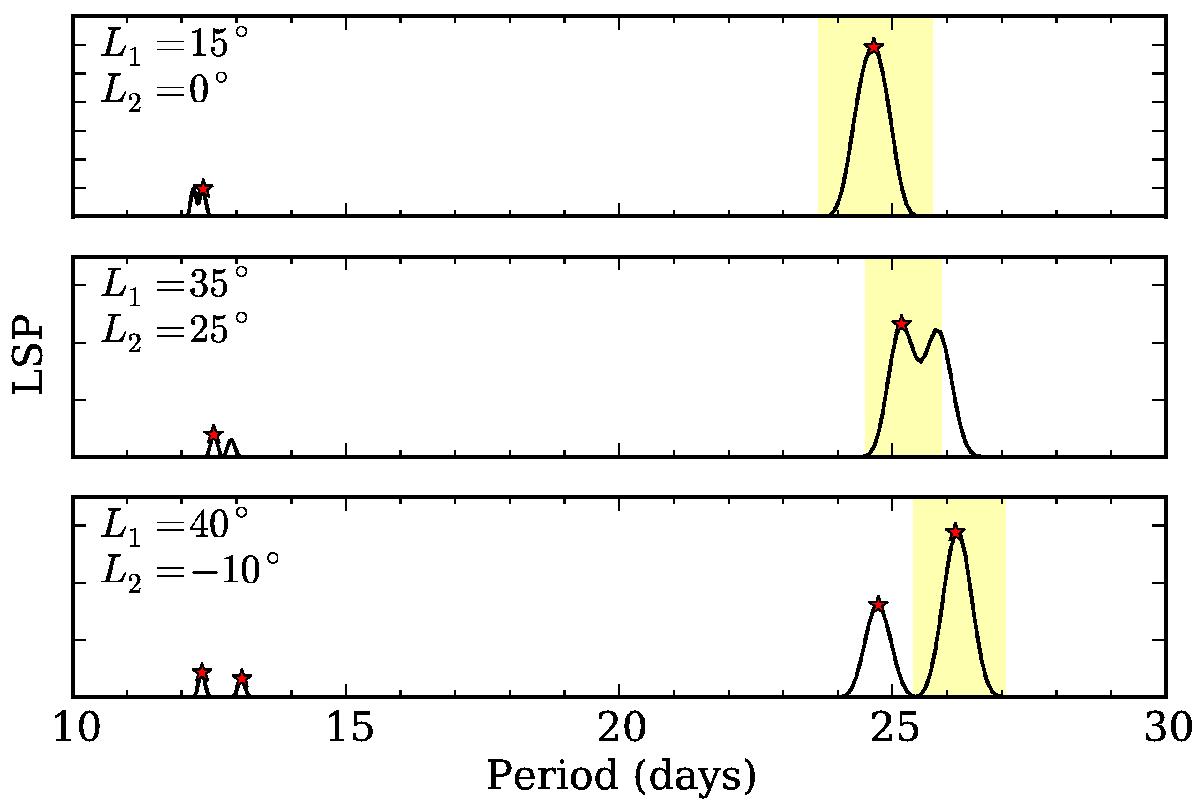
Lomb-Scargle periogram for three synthetic light curves from simulations with two spots at different latitudes, L1 and L2. Top panel: only one rotation period is detected. Middle panel: two peaks associated with the surface rotation are seen but the second is not within the detectable period range. Bottom panel: the rotation periods associated with each spot latitude are successfully detected. The spot latitudes are indicated in the left top left corner of each panel. The red symbols mark the first and second harmonics if detected. The yellow regions mark the detectability limit we impose (see text for details).
Current usage metrics show cumulative count of Article Views (full-text article views including HTML views, PDF and ePub downloads, according to the available data) and Abstracts Views on Vision4Press platform.
Data correspond to usage on the plateform after 2015. The current usage metrics is available 48-96 hours after online publication and is updated daily on week days.
Initial download of the metrics may take a while.