Fig. 9
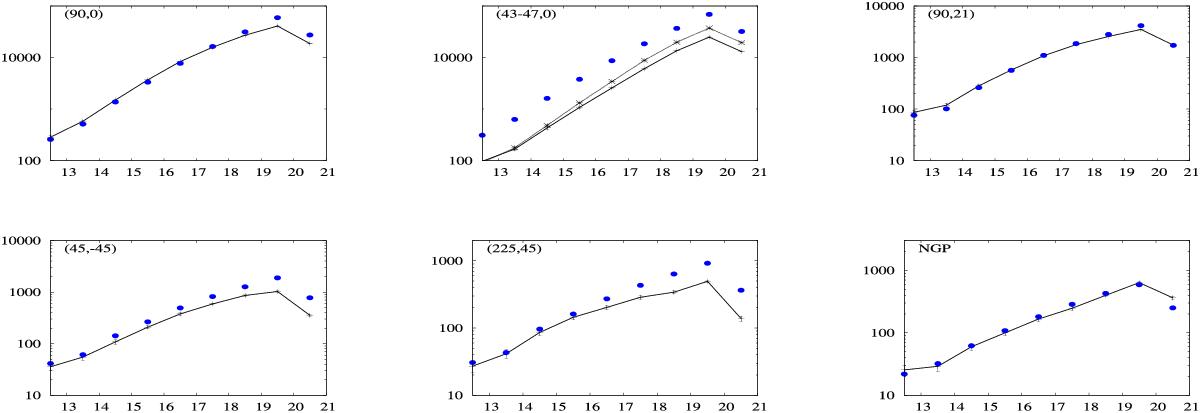
Star counts per square degree as a function of magnitude in several (l, b) directions. Crosses linked with lines are for Gaia DR1 data, filled blue circles are simulations from GOG18. Error bars represent the Poisson noise for one square degree field. The bottom row shows two regions impacted by the scanning law and the filtering of stars with a low number of observations.
Current usage metrics show cumulative count of Article Views (full-text article views including HTML views, PDF and ePub downloads, according to the available data) and Abstracts Views on Vision4Press platform.
Data correspond to usage on the plateform after 2015. The current usage metrics is available 48-96 hours after online publication and is updated daily on week days.
Initial download of the metrics may take a while.