Free Access
Fig. 43
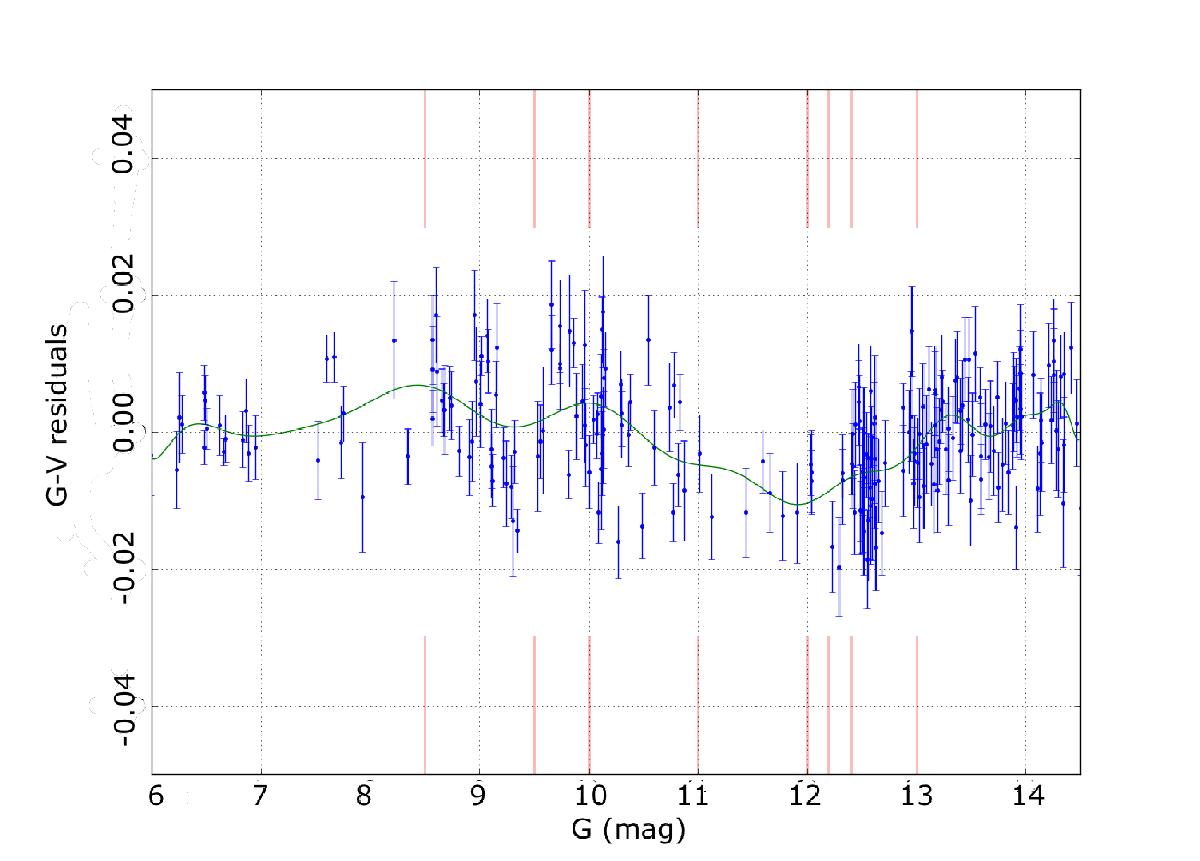
Residuals of the difference G−V against a low-order spline, as a function of the magnitude, for five different clusters. The V magnitude is from the Taylor et al. (2008) catalogue. The red lines mark the gate positions in magnitude. The green curve is a high-order spline fit to the data.
Current usage metrics show cumulative count of Article Views (full-text article views including HTML views, PDF and ePub downloads, according to the available data) and Abstracts Views on Vision4Press platform.
Data correspond to usage on the plateform after 2015. The current usage metrics is available 48-96 hours after online publication and is updated daily on week days.
Initial download of the metrics may take a while.