Free Access
Fig. 36
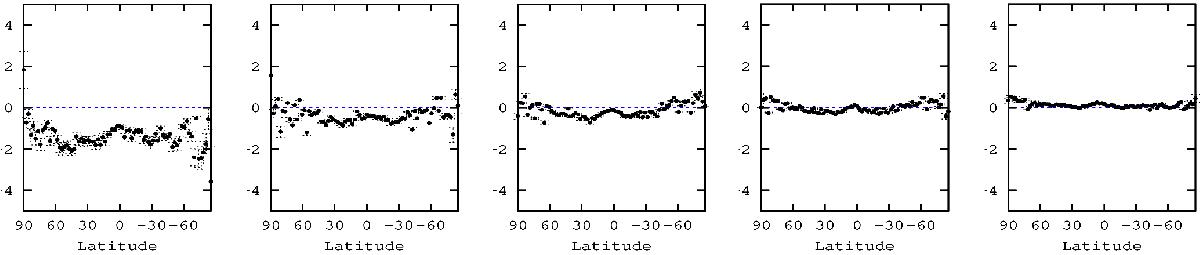
Mean difference in parallax in mas between the BGMBTG2 model simulation and the TGAS data, in different rings of latitude, for five magnitude bins in VTfrom left to right, from 9−9.5 (left) to 11−11.5 (right).
Current usage metrics show cumulative count of Article Views (full-text article views including HTML views, PDF and ePub downloads, according to the available data) and Abstracts Views on Vision4Press platform.
Data correspond to usage on the plateform after 2015. The current usage metrics is available 48-96 hours after online publication and is updated daily on week days.
Initial download of the metrics may take a while.