Free Access
Fig. 30
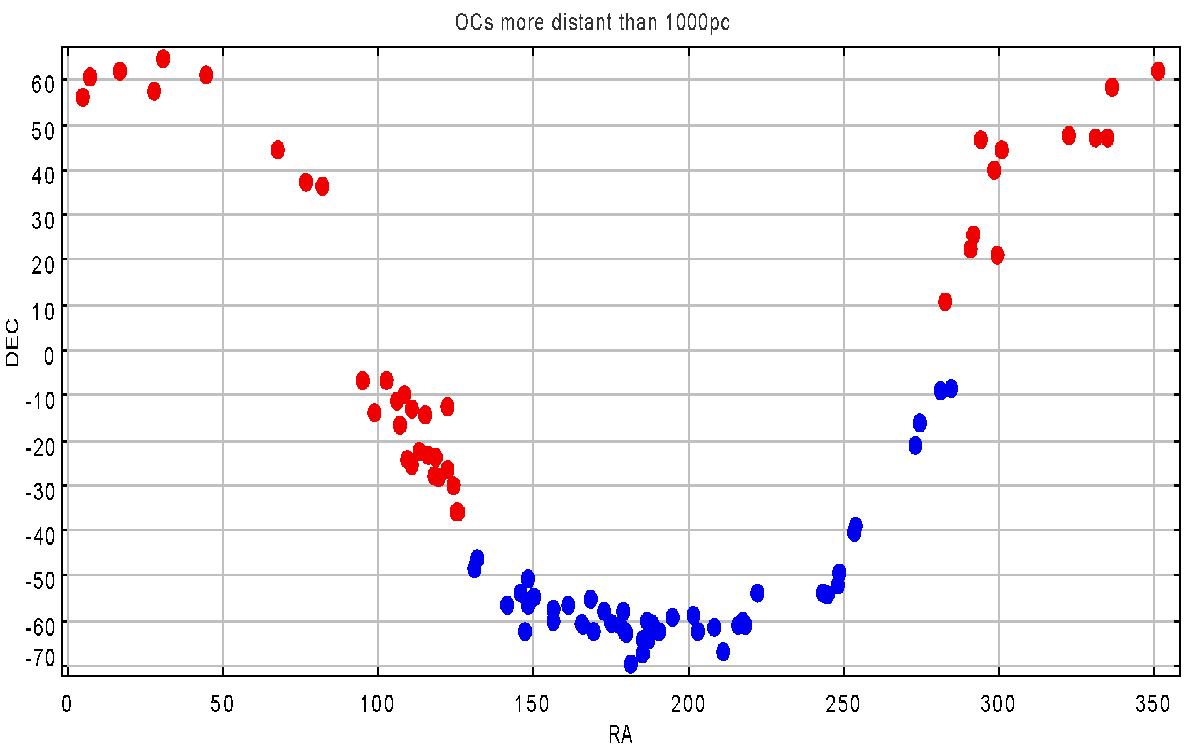
Sky distribution of open clusters more distant than 1000 pc. The blue group appears to contain objects with underestimated parallaxes, while the red group contains overestimated parallaxes (Fig. 29).
Current usage metrics show cumulative count of Article Views (full-text article views including HTML views, PDF and ePub downloads, according to the available data) and Abstracts Views on Vision4Press platform.
Data correspond to usage on the plateform after 2015. The current usage metrics is available 48-96 hours after online publication and is updated daily on week days.
Initial download of the metrics may take a while.