Free Access
Fig. 29
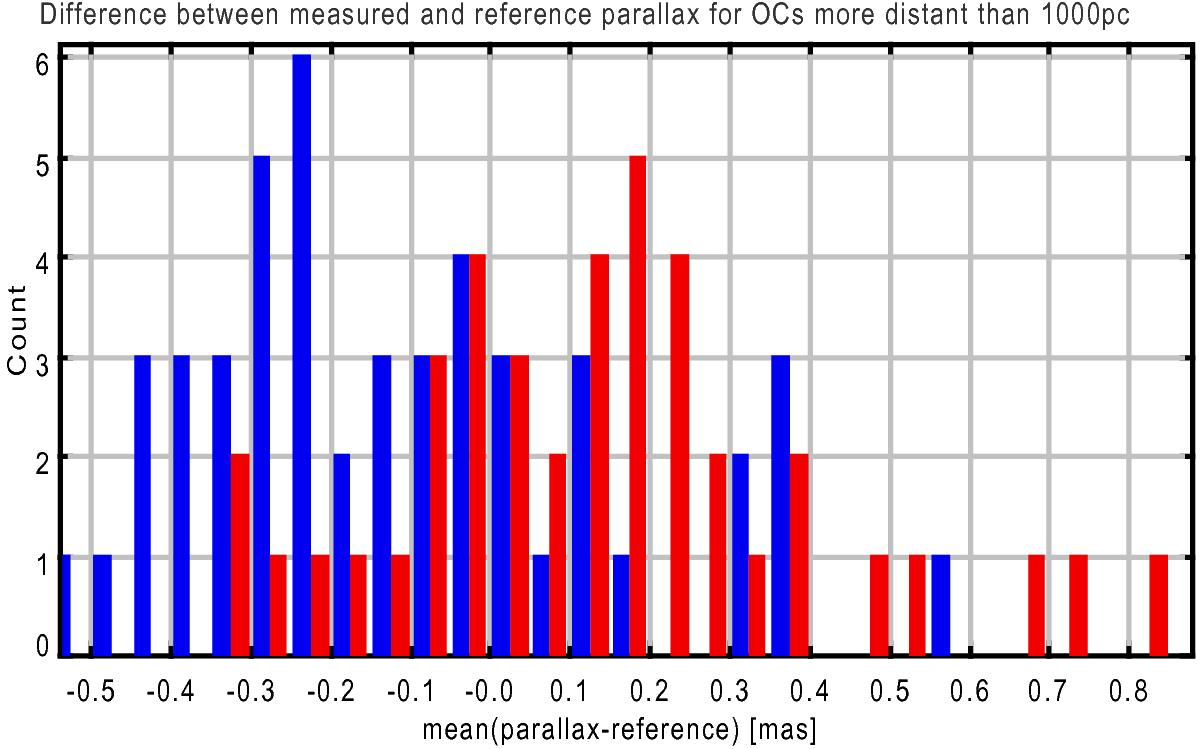
Distribution of the differences between the mean TGAS parallaxes and the one from photometric distance for the distant open clusters. Red and blue labels are attributed to the clusters defined in Fig. 30.
Current usage metrics show cumulative count of Article Views (full-text article views including HTML views, PDF and ePub downloads, according to the available data) and Abstracts Views on Vision4Press platform.
Data correspond to usage on the plateform after 2015. The current usage metrics is available 48-96 hours after online publication and is updated daily on week days.
Initial download of the metrics may take a while.