Fig. 22
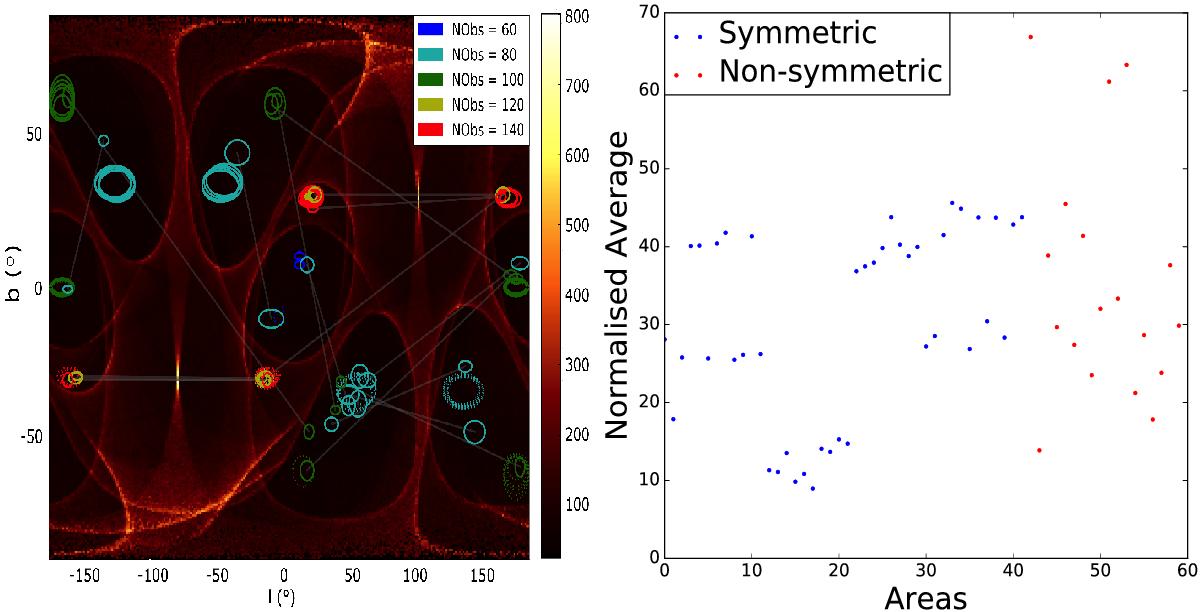
Left: distribution of regions for which the mutual information has been computed, where the inset indicates the number of observations inside the regions. The regions are circles in l−sinb space, with the positive b region in solid and its symmetric counterpart in dashed. Regions that are compared and are not symmetric are connected by a grey line. Right: average deviation of the mutual information between a region and its counterpart, in (red) blue for (non-) symmetric counterparts.
Current usage metrics show cumulative count of Article Views (full-text article views including HTML views, PDF and ePub downloads, according to the available data) and Abstracts Views on Vision4Press platform.
Data correspond to usage on the plateform after 2015. The current usage metrics is available 48-96 hours after online publication and is updated daily on week days.
Initial download of the metrics may take a while.