Free Access
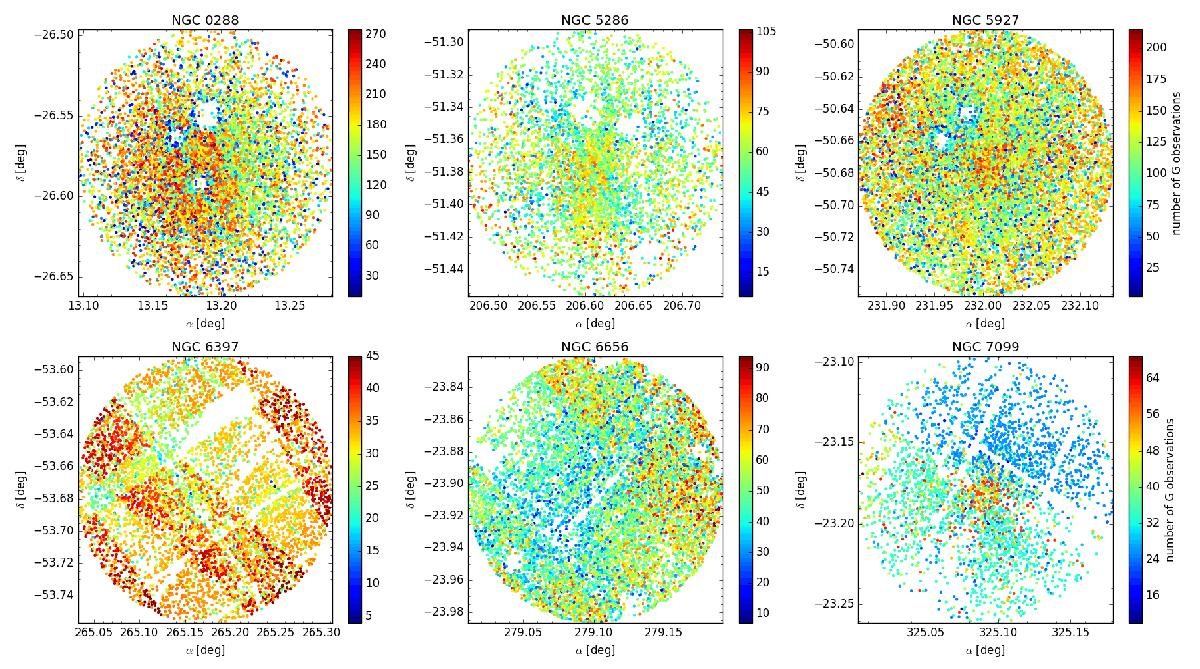
Fig. 13

Stellar distribution for six chosen GCs, colour-coded by number of G observation for each star. Top row: examples of holes caused by limited on-board resources or bright stars. Bottom row: in some regions patterns are visible corresponding to stripes where no stars had a sufficient number of observations.
Current usage metrics show cumulative count of Article Views (full-text article views including HTML views, PDF and ePub downloads, according to the available data) and Abstracts Views on Vision4Press platform.
Data correspond to usage on the plateform after 2015. The current usage metrics is available 48-96 hours after online publication and is updated daily on week days.
Initial download of the metrics may take a while.


