Fig. 7
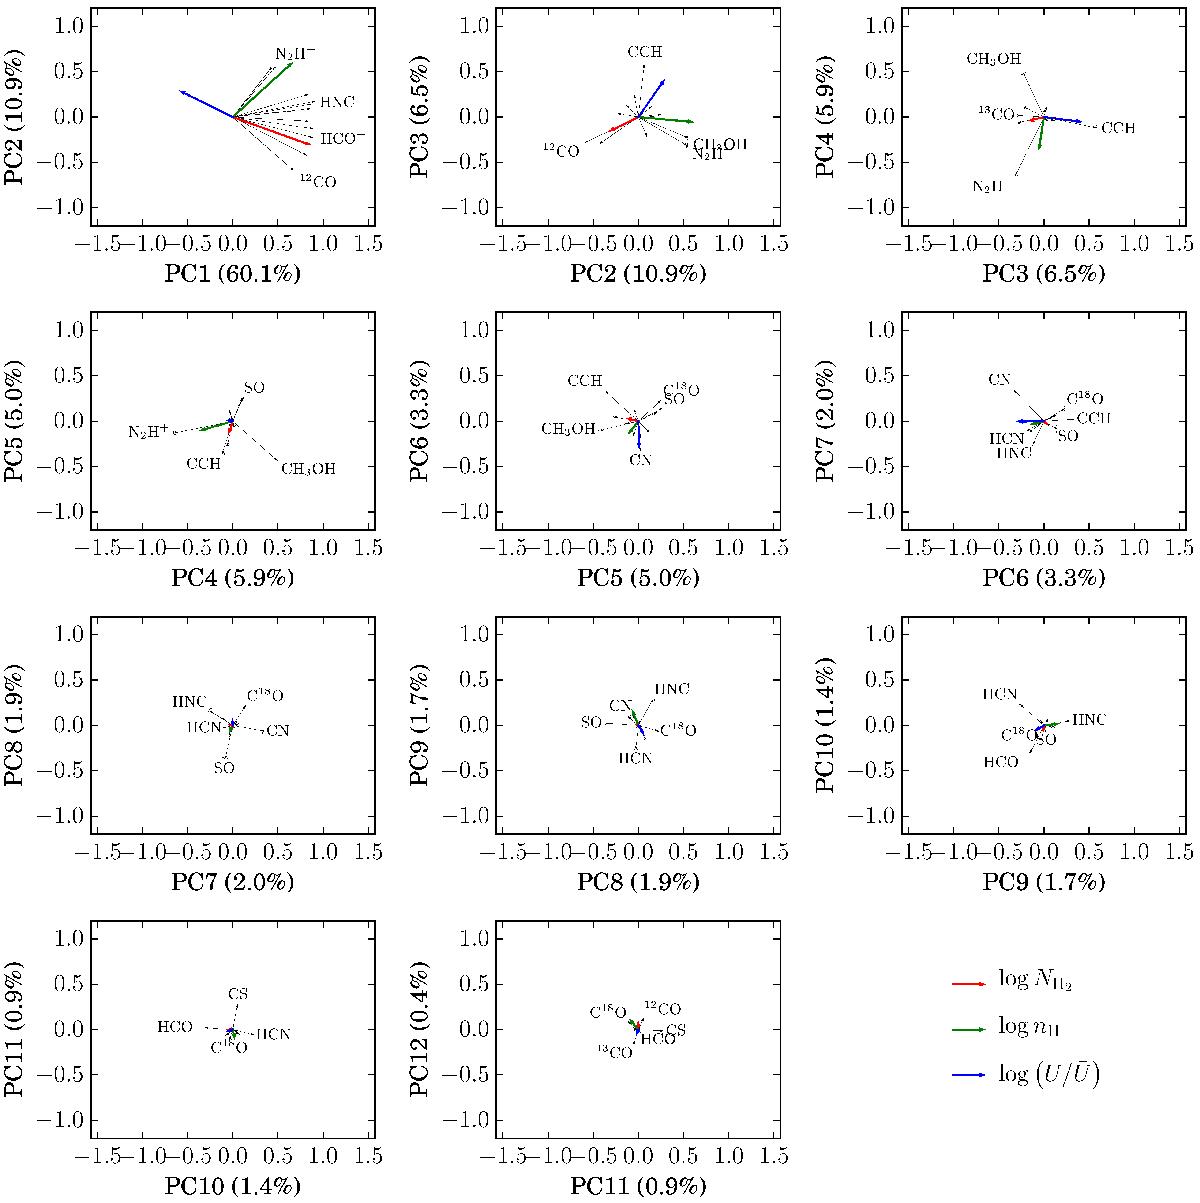
Correlation wheels, showing the initial line intensities as vectors having as coordinates their correlation coefficients to each PC, represented in the planes of successive pairs of PCs. Uncertainties from our bootstraping analysis (see Sect. 4.3) are presented as thin black contours around the arrows’ heads (isodensity contours containing 68% of the distribution). Also represented in colored arrows are the correlations of our independent physical parameters with the PCs (red: log NH2, green: log nH, blue: ![]() ).
).
Current usage metrics show cumulative count of Article Views (full-text article views including HTML views, PDF and ePub downloads, according to the available data) and Abstracts Views on Vision4Press platform.
Data correspond to usage on the plateform after 2015. The current usage metrics is available 48-96 hours after online publication and is updated daily on week days.
Initial download of the metrics may take a while.