Free Access
Fig. 6
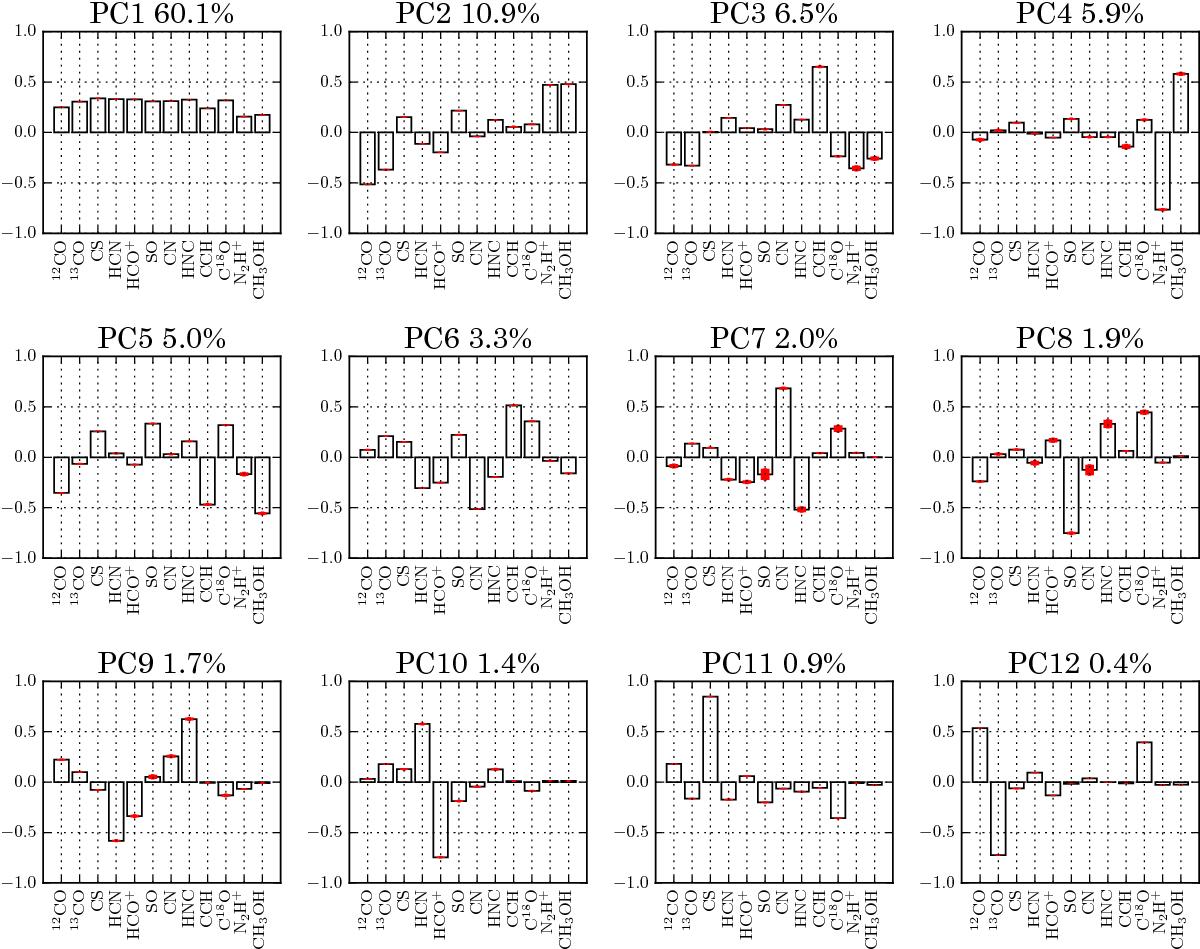
Bar plots showing the contribution of each line intensity to each principal component (with the fraction of the total correlation accounted for by each PC given as a percentage). The uncertainties (standard deviations) shown in red are obtained by bootstrapping as described in Sect. 4.3.
Current usage metrics show cumulative count of Article Views (full-text article views including HTML views, PDF and ePub downloads, according to the available data) and Abstracts Views on Vision4Press platform.
Data correspond to usage on the plateform after 2015. The current usage metrics is available 48-96 hours after online publication and is updated daily on week days.
Initial download of the metrics may take a while.