Fig. 7
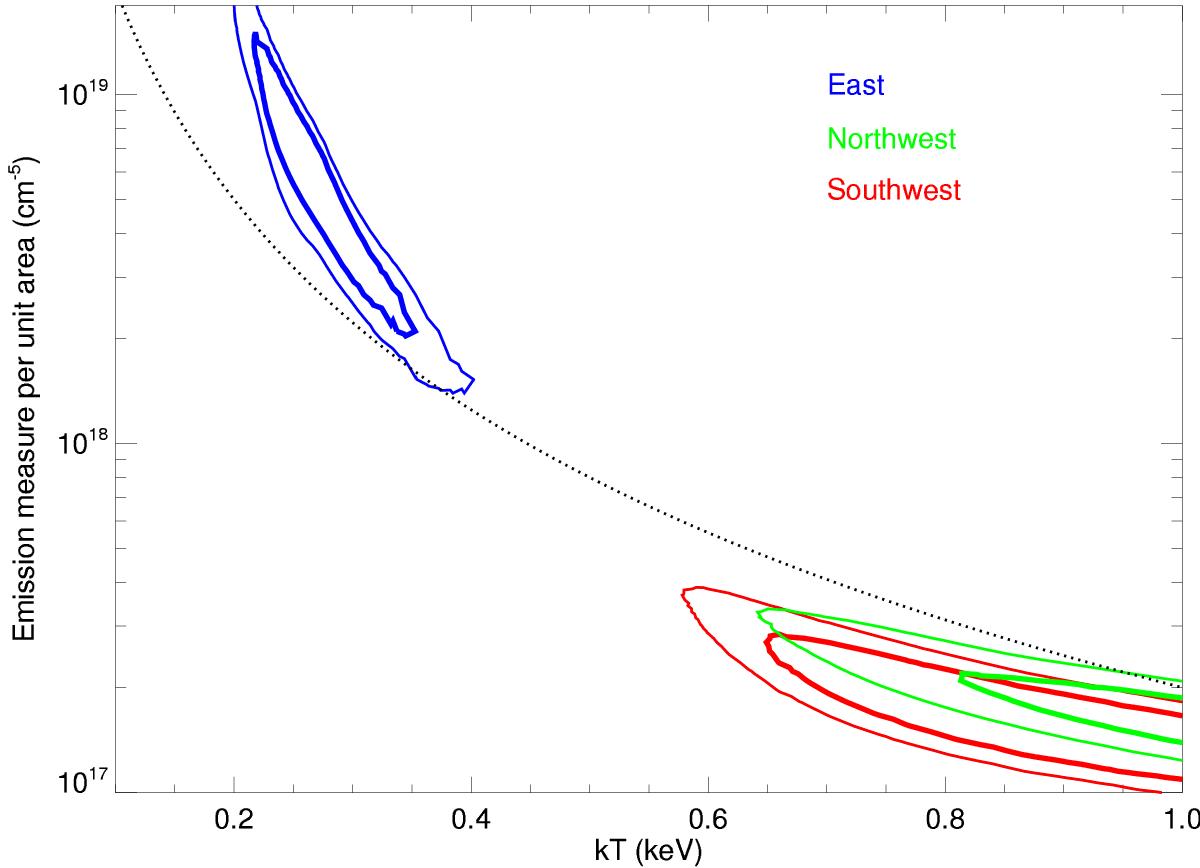
68% (thick lines) and 90% (thin lines) confidence contour levels of the plasma emission measure per unit area, EM, versus the temperature, kT, for regions East (blue), Northwest (green) and Southwest (red). The dotted curve shows the expected trend for increasing ambient density (EM ∝ 1/(kT)2), assuming the same extension along the line of sight in all the regions (see Sect. 4).
Current usage metrics show cumulative count of Article Views (full-text article views including HTML views, PDF and ePub downloads, according to the available data) and Abstracts Views on Vision4Press platform.
Data correspond to usage on the plateform after 2015. The current usage metrics is available 48-96 hours after online publication and is updated daily on week days.
Initial download of the metrics may take a while.